This week we've released a significant update for our customers with advanced performance tracking needs — support for Garmin Connect IQ data metrics and sensors. We are super excited about this new feature and the possibilities it opens up for post-workout analysis. Judging from the CIQ data we're seeing flow into the platform, all of you are going to be excited too.
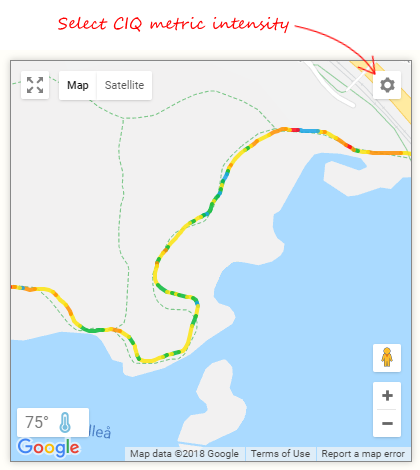
If you're already using a Garmin CIQ app that records data with auto-sync from Garmin Connect there's nothing you need to do; data will start appearing in the chart on the Workout Detail page when you finish your next run or ride. You can pick any recorded CIQ metric to view along with all your standard metrics such as heart rate, power, speed, elevation, etc. You can also pick any custom CIQ metric to color-code the intensity of your route with our map tracks, easily showing changes based on terrain, surface or grade.
If you're new to CIQ apps or want to get into the details keep reading.
What is new
This week adds several new features that we are going to build on this spring and summer.
- When importing a FIT file or syncing from Garmin Connect or any other service or app, if the workout contains recorded CIQ sensor data it will be imported and stored with your workout data.
- If the workout being imported has a new CIQ field (new to the athlete), a custom field will be created with the field name, units label and a color from our beautiful palette.
- Custom sensor data will be displayed in workout details, available as a selectable chart metric like any other.
- The custom metric will also be available to color-code the intensity of your route.
You can use all the existing chart and mapping tools to analyze this data, select a segment to see data within a distance or time range, overlay with other metrics, and even use these metrics on the workout compare page to see changes over time.
Digging into CIQ apps
As we rolled this out this week we have been astonished at all the CIQ data fields coming in and the apps people are using. It turns out about 8% of our athletes are tracking workouts with custom data. Crazy! So what are people using? Lets look.
Stryd Running
![]()
It's no surprise our most used app is for the Stryd run power pod. In addition to run power (which we have been displaying for a long time) you can now gain insight into form power and leg spring stiffness changes during your run. FIT files from runs recorded with the Stryd Apple Watch app will display these metrics in SportTracks as well.
RunScribe Plus

RunScribe is a great system. In addition to the standard running dynamics and power data you get from Garmin and others, RunScribe gives you information about footstrike location, pronation angle, impact force and braking force — for each foot!
W Prime Balance
If you're a cyclist using a power meter W' balance is a way to visualize how much "gas is in the tank" after high intensity efforts above FTP. This is a super useful data field for live tracking, but also valuable for post-ride analysis.
VO2 Estimation
There's more than a dozen VO2 estimation apps on the Garmin app store. Take your pick. This seems to be a very popular piece of data.
Running economy
The Flexirunner app brings several new CIQ fields, including running economy. This is another great piece of data to look at for post-run analysis in combination with your route and terrain conditions.
Of course, this is just a tiny example of the apps available on the Garmin CIQ app store. The sky is the limit. Check it out.
What's next
If you were paying attention, you may have noticed in the info above that I mentioned when a new CIQ field is imported we create a custom field for it. This feature update includes an entirely new piece of infrastructure for custom fields that we will be adding later this year — to workouts, gear and athlete health measurements. This means in the near future you will be able to set the color and label for your CIQ fields (or hide them), and farther down the road you will be able to add completely new custom fields, to track whatever you want.
Another idea we are working on is improving the display of summarized data for these fields. Seeing the detailed data over the course of a ride or run is great, but wouldn't it be nice to see a sumarized average, or maximum value in a total block, or on the Workouts page, and to see zone duration breakouts on the Analysis page, and historical trending and charts? Our goal is to integrate customized field data throughout the entire app, so it looks just like the "standard" fields.
That's all for now. So what is your favorite CIQ app?