Quantcast
Channel: SportTracks blogs
Viewing all 221 articles
Browse latest View live

Pace: Inverted

$
0
0

Faster is better! But faster is lower?? Because... you trim time from your run... so pace goes down when speed goes up. Or does it go up when it goes down? Or maybe both?

Traditional pace charts can be confusing! A fact that is reflected in the customer idea titled "Invert the pace on the analysis charts" that has been floating near the top of our vote count for awhile.

Our update today now allows you to choose whether you want your pace charts to show faster pace on bottom (the default) or on top. To change the setting go to the My Account > Preferences page and select one of the Pace setting options, either "Lower is Faster" or "Higher is Faster".

By selecting "Higher is Faster" the default pace charts will be inverted from their normal format. This setting changes the following pages:

  • Workout detail: Summary tab pace charts
  • Workout detail: Interval tab pace column bars
  • Workouts page: Pace column bars
  • Analysis page: Line, bar, scatter and bubble plots

And that's it! A simple feature that will make a lot of people happy.

~Enjoy

How To
https://cache.sporttracks.mobi/blog/images/2020/07/pace-cover.jpg

The new Garmin Instinct Solar

$
0
0

If you thought the destiny of all modern watches was to get thinner and smaller, then you might be surprised at the wild popularity of Garmin's Instinct line, which are intentionally thick and bulky. Garmin just expanded this series with the new Instinct Solar, adding several big upgrades and improvements and the best-ever battery life of any Garmin wearable.

It's easy to mistake the Instinct Solar is just another rugged outdoors watch, but it has most of the features in Garmin's high-end GPS sports watches. It lets you track all of your runs, rides, swims, hikes and adventures, and thanks to our auto-sync partnership with Garmin, all of your activities are automatically loaded into SportTracks for analysis and planning.

The Garmin Instinct Solar watch in Tidal Blue color

The show-stopping feature of this new model are its built-in solar panels and the dramatic increases they can bring to battery life. An energy-saving Sony chipset is also onboard, as is the Garmin Elevate optical heart-rate and Pulse Ox sensor array, both of which help to make the battery life of the Instinct Solar exceptional.

What's different about the Garmin Instinct Solar? 

The new Instinct Solar looks almost identical to the original Garmin Instinct, which was released back in 2018. But there are a few visual changes you can see:

A graphic showing the original Garmin Instinct sports watch and all of the changes made to the Garmin Instinct Solar

The solar panel around the bezel of the Instinct Solar is significantly larger than the one on the Fenix 6X Pro Solar Edition, which was released in September 2019 and was Garmin's first solar-capable watch. As you would expect, the larger panel captures more energy and delivers longer performance.

The Instinct Solar can last from 24 to 54 days in Smartwatch Mode, but it needs direct sunlight for 3 hours a day for maximum life. It also has a Battery Saver Mode that delivers from 56 days to unlimited life, but again, it needs a daily dose of exposure to 50,000 lux light for 3 hours. For sports tracking, GPS Mode gets from 30 to 38 hours with sun. Max Battery GPS Mode delivers 70 to 145 hours, and an Expedition GPS Activity Mode provides 28 to 68 days with sunshine.

The other visual change is the Garmin Elevate optical sensor array on the back of the watch:

The back of the original Garmin Instinct sports watch compared to the back of the Garmin Instinct Solar

The Garmin Elevate optical sensors are more power efficient than the older heart-rate monitor, and it now provides a Pulse Ox sensor as well. This measures your SpO2%, which can tell you how well your body is absorbing oxygen. When you take a Pulse Ox reading, you get a percentage that should be 95% or higher. Low readings can be a sign of trouble, especially at higher altitudes. You can learn more about Pulse Ox in our Heart-Rate Monitor Tech article.

Another advantage of the heart-rate monitor on the new Instinct Solar is that it now works underwater. If you want to gain a competitive edge, this new capability lets you utilize heart-rate data to improve swim performance. The Instinct allows you to track lap-pool swims, but it also has the ability to track open-water swim workouts, a feature that isn't available on popular watches like the Garmin Forerunner 245.

What's missing on the Garmin Instinct Solar?

Even though the Instinct Solar has many of the features of the top-of-the-line Fenix 6 series, there are several big omissions. Most notably, it cannot access Connect IQ, which is Garmin's app ecosystem. There's a vast number of excellent apps and custom data screens available on Connect IQ that are all free and made by both Garmin and third-party developers. This makes it possible to choose from hundreds of watch faces, rather than the meager 12 that come with the Instinct Solar.

This also means you can't use external sensors like the Stryd foot pod or the Garmin Running Dynamics Pod. If you need a watch that supports running power, you need to look elsewhere because the Instinct series is incapable. It's a shame because Connect IQ adds so much to the Garmin watch experience. Connect IQ apps and data fields can provide lots of unique and valuable performance data, which you can analyze with your other fitness metrics in SportTracks.

Also take note that the screen of the Instinct is monochrome, not color. There are no maps, just breadcrumb navigation. If you're a triathlete, understand that there are no multi-sport modes on the Instinct Solar.

Final thoughts...

There's a lot to like about the Garmin Instinct watches. They're built tough with thermal and shock resistance, and waterproof up to 328 feet (100 meters). There are several different colors available, from eye-catching Flame Red and Sunburst Yellow, to more subdued blacks and grays. Speaking of dude, there's a Surf Edition of the Instinct Solar available, which features tide data and a surfing sport mode. Like the original Instinct, there's also a Tactical Edition that's compatible with night vision and features a stealth mode.

Here are some more appealing features:

  • Supports GPS, GLONASS and Galileo satellite systems
  • Supports smart notifications (texts, calls, emails, social media, etc.)
  • A Power Manager feature lets you create custom battery-saving modes to suit your needs
  • Includes an altimeter, a barometer, and an electronic compass
  • A back-to-start feature can help you navigate to back to safety
  • The circular cut-out screen on the display makes it a more intuitive device  

Thanks for checking out this post! You can learn more about recent Garmin sports devices here

Community
https://cache.sporttracks.mobi/blog/images/2020/07/garmin-instinct-solar-cover.jpg

Biking Up the Mountain

$
0
0

Do you only ride on flat routes? Do you shift gears just to speed up and slow down? Does the largest cog on your rear cassette get the least amount of use? If you answered yes to these questions, this article may not be for you because it's about the specialized skill of climbing in cycling. We look at factors that make it so challenging, and show you the metrics to focus on for improvement.

Gravity: The force is against you

The same thing that keeps your coffee mug planted on the desk beside you is what makes climbing so difficult: gravity. There's no better reminder that you're not riding an eBike, moped, or Harley Davidson than pushing the cranks on a steep incline. Even a short, low-grade hill is enough bring inexperienced bike riders to a complete stop.

A group of road cyclists riding uphill with SportTracks training software overlaid on the photo

The steeper the hill, the more difficult it gets to fight gravity and climb upward. There are adjustments you can make that help ease this burden. You can get a bike that was designed for climbing, which essentially means it uses the most lightweight components in its price class. You can also opt to wear minimal kit, only carry necessary items, and to use a compact bike computer.

When you have all of the "weight weenie" aspects of the ride figured out, the only things left to improve are your body and mind, and working on these two items will go much further than shaving a few grams off your bike. An essential requirement here is to optimize your cycling form, reducing inefficient motions and habits as much as possible. Mentally, you need to proactively avoid negative thoughts. Long, repetitive climbs can wreak havoc on your mental game.

Keep those legs spinning

Lots of energy is required to turn your pedals when going uphill, which can transform a ride from a slowtwitch-muscle endurance workout into a fast-twitch effort. If you've got a decent amount of climbing to do, it's best to try to keep it in endurance mode by maintaining a high cadence. Cadence is the number of times you spin your pedals in a minute, and keeping it above 85 RPM will provide more of a cardiovascular workout and keep your legs fresher by avoiding the buildup of lactic acid.

Learn more about cadence and how to improve it in our What Is Good Cycling Cadence article.

In order to track cadence on your bike, you can count pedal strokes in your head, or you can use a cadence sensor paired with your sports watch or bike computer. It's extremely beneficial to keep an eye on your cadence as you ride, as it's common to start dropping your cadence number without realizing it. It's also helpful to analyze your cadence data after your workout. SportTracks makes it easy to compare two rides, so you can see if your cadence numbers are maintaining or increasing on the same hill over time.

The power of watts/kg

If your bike is outfitted with a power meter, you have access to one of the most useful metrics for improving performance on the hills: watts/kg. This is your power output relative to weight (it stands for watts per kilogram). This number helps coaches compare one rider against another, but on the individual level it can help you understand if your training adaptations are successfully making you more powerful on the mountain.

The beauty of watts/kg is that it's both simple to understand, and incredibly meaningful. If you're getting more powerful at the same weight, you're making progress. If you're getting more powerful at a lower weight, you're going to make substantial gains on climbs. This is yet another area where it's beneficial to ride the same routes and hills for workout comparison. SportTracks provides your watts/kg on workout detail pages, and you can add this metric to your Workouts page with other data to look for trends.

The workouts screen in SportTracks training software showing watts/kg compared to cycling cadence

VAM = Vertical cycling speed

Another way to capitalize on riding the same routes for comparison is to analyze your VAM. This metric was born for the hills as it measures your vertical speed, letting you know how many meters you climbed per hour. No dedicated hardware sensors are required to track VAM, as SportTracks automatically calculates it and adds it to any workout with GPS data. You can learn all about it in our Using VAM in Cycling article.

Riding hills is a reliable way to get fresh air and take in well-earned views and vistas, but if your primary goal is to improve, you need to intentionally target specific metrics. Threshold training benefits all kinds of cycling disciplines, and it's also effective in the hills. FTP (Functional Threshold Power) is the maximum power you can hold for one hour without slowing down. Regularly executing workouts that target your current Cycling FTP will help you power up hills, however, to gain this edge dedication and consistency are required.

Regular strength-training routines throughout each week are also key to unlocking your climbing potential. But don't pump iron like a bodybuilder, you need to focus on cycling-specific exercises. To erase any guesswork, start with the drills covered in our article about improving bike power

As you intentionally train in all of the areas covered in this article, always keep proper cycling form top of mind as you ride. Your upper body needs to remain relaxed. Your breathing should be deep and controlled. You need to stay in the saddle, no matter how steep the incline. And as you train physically, use the stress to improve your mental game.

Thanks for reading this post! For more training tips check out our other cycling articles.

Training
https://cache.sporttracks.mobi/blog/images/2020/08/how-to-train-for-climbing-cyclists-cover.jpg

Chart Zone Striping

$
0
0

Training specificity is a key principle of performance training. That means targeting a specific performance zone, whether that is pace, speed, power or heart-rate, and sticking to that zone for an intended duration. 

So how do you validate whether you stayed in your target zones after the workout and if you need to tweak your training? If you want to know the time you spent in training zones for the entire workout you can look at the charts on the analysis tab of the workout details. But for workouts with mixed intensity periods — such as intervals, or hill training, etc. — this doesn't tell you all the details you need.

Now you can quickly view which performance zone you're in during specific periods of a workout by enabling zone striping in the chart. To turn on the zone striping feature click the zones button in the chart toolbar:

Enabled zones will be shown for the first metric you've selected in the chart:

You can still use the chart overlay features if you want to view zone information versus other metrics, for example the elevation, grade, or power changes:

You can always adjust your zones by selecting your profile picture in the right corner, then selecting My Account, and then hitting the Training Options tab on the left. Here you can make custom zones for running, cycling, swimming, or any other sport, and create zones for speed, heart-rate, power, and cadence. You can add or remove the number or zones for each metric, customize the range of each zone, and give them unique names. The names you choose will be displayed in your zone stripes:

Thats all there is to it. Enjoy this new feature!

How To
https://cache.sporttracks.mobi/blog/images/2020/08/zone-stripes-cover.jpg

Foot Strike and Shoe Choice

$
0
0

Foot strike: it's where the rubber meets the road in running, and the mechanics of how your feet interact with the ground can help determine which type of running shoe will best suit your needs. In this post, we take a close look at the intricacies of foot striking in running, and how it relates to running shoe design and choice.

There are two "macro-categories" of running shoes: neutral and control. Neutral shoes have a foam midsole that's the same density throughout. They're flexible through the arch and are best suited for runners and walkers who "supinate", which means they distribute their weight mostly on the outside of their feet and ankles as they move through the gait cycle. People who have neutral pronation typically maintain and even footfall.

Control shoes feature denser material on the inside to add rigidity through the arch. This is how control shoes off-set for overpronation, which is the tendency to roll excessively to the inside as one moves through the running and walking gait cycle.

A graphic chart showing pronation, neutral, and supination of runner's feet and ankles

Your ideal running shoe should help you achieve neutral running mechanics. For some of us, this is our natural tendency, while others are naturally inclined to overpronate. Visit your local running specialty store for a fit process to identify your gait type and the category of shoe that's right for you!

What are conventional trainers?

Definition: A cushioned everyday running shoe that utilizes a midsole stack height of 32 to 28 mm in the heel and 22 to 18 mm in the forefoot, and an 8 to 12 mm heel-to-toe offset.

What does this mean? Shoes in this category use a higher heel-to-toe offset, which serves to cushion heel striking, and shorten the achilles tendon, thus off-loading and reducing stress on activation of the calves, the achilles tendon itself, plantar fascia, and more. This type of shoe allows for a heel strike by cushioning impact for the structure of the rearfoot and lower leg.

Who would a fit specialist recommend this type of shoe for? Runners and walkers who are definitive heel-strikers. They are for runners and walkers who have calf pain and tightness, those with achilles tendonitis, plantar fasciitis, or other issues with tension and inflammation of the rearfoot or lower leg. They're also good for people that are new to the impact of regular running and walking.

Other things to note: There are plenty of neutral shoe options in the conventional trainer category, and this is where nearly all options we would label as control shoes reside. Some popular models in this category include:

  • Neutral: Brooks Ghost, Saucony Ride, New Balance 880, Mizuno Wave Rider, Asics Gel Cumulus
  • Control: Brooks Ravenna, Brooks Adrenaline, Saucony Guide, Saucony Omni, New Balance 860, Mizuno Wave Inspire, Asics GT 2000

What are low-drop trainers?

Definition: An everyday running shoe that utilizes a midsole stack height lower than that of a conventional trainer and a 0 to 6 mm heel-to-toe offset.

A graphic showing the heel-to-toe offset of a Brooks Ghost running shoe

What does this mean? A shoe with a lower heel-to-toe offset encourages and facilitates a midfoot or forefoot strike by keeping the foot in more level position in the absence of extra midsole underneath the heel. Low drop shoes are available with varying levels of cushioning, and it is true that those with less cushioning, or a lower midsole stacking height will emphasize a midfoot or forefoot landing more so than those with more cushioning.

Who would a fit specialist recommend this type of shoe for? Runners who are naturally definitive midfoot or forefoot strikers. Since these athletes aren't experiencing a lot of heel contact with the ground anyway, they may not really need or benefit from the additional heel cushioning that comes with a shoe with a higher drop. Trail runners are often partial to lower drop footwear as well, as uneven technical terrain tends to keep them on their toes (literally!) most of the time. Low-drop shoes are also popular for cross-training activities such as weightlifting and boot camp because they offer a more level, balanced stance for lifting activities than something with a higher ramp. Furthermore, low-drop shoes with less cushioning tend to be more flexible, allowing for lateral movements that are often part of group exercise or athletic conditioning classes.

Other things to note: Most lightweight, low-drop shoes are neutral. Some runners and researchers might say that this type of footwear addresses mechanical inefficiencies of the gait by recruiting and strengthening small stabilization muscles of the foot and leg rather than building corrective mechanisms into the shoe, as a control shoe would. If you're intrigued by low-drop shoes, by all means, check them out. However, if you have historically run in a conventional trainer it is recommended to gradually integrate low-drop shoes into your training routine. Remember that running in this type of shoe may activate or place more load on your calves, so some initial tension or soreness is a normal adaptation. You can keep calf discomfort to a minimum by slowly transitioning to running most of your miles in your low-drop shoes.

Some brands that make low drop footwear include Altra, Hoka One One, Topo, and On.

What type of heel-to-toe offset is right for me?

Currently, there is no substantial scientific evidence that supports any specific heel-to-toe offset as ideal. There are many different types of feet and gait mechanics out there, and different things work for different people. My advice is to prioritize comfort over any technical specifications as you shop for your next pair of running shoes.

No matter what kind of shoe you decide to use, definitely track their usage. The more miles you put on your trainers, the more the foam and other materials will breakdown, lose effectiveness, become a potential hazard, and impede your performance. SportTracks offers robust tools for tracking gear, such as automatically including gear with sport types, grouping gear (track your footpod and shoes automatically), bulk editing, and much more.

Left and right foot pronation chart in SportTracks endurance sports software with data from Runscribe Plus footpods

If you want more insight on your gait and foot striking mechanics, SportTracks is compatible with Runscribe footpods. These devices attach to your running shoes and provide a rich array of running efficiency metrics. In addition to all of the standard running data you get, like Pace, Level Pace, Stride Length, Elevation and more, workouts with Runscribe data in SportTracks allow you to analyze the following metrics:

  • Braking Force (Left)
  • Braking Force (Right)
  • Foot Strike (Left)
  • Foot Strike (Right)
  • Ground Contact TIme (Left)
  • Ground Contact Time (Right)
  • Impact Force (Left)
  • Impact Force (Right)
  • Pronation (Left)
  • Pronation (Right)

Thanks for reading this post! If you have any questions about foot striking and shoe choice, please share them in the Comments below!

Training
https://cache.sporttracks.mobi/blog/images/2020/09/foot-strike-heel-to-toe-graphic-cover.jpg

Heel Striking and Cadence

$
0
0

One of the most common bits of advice among runners is that you shouldn't "heel strike" when you run. It's generally viewed as poor running form that can slow you down and cause injuries. But if this is the case, why do so many elite runners and racing champions run this way? Does heel striking deserve such a bad reputation? We reached out to experienced physical therapists that specialize in endurance sports to get a definitive answer.

What is heel striking?

An illustration of a runner heel striking

First, let's cover the basics. Heel striking is when a runner's heel is the first part of their foot to make contact with the ground during a stride. Problems tend to arise when the knee is fully extended, and the heel lands out in front of the body. The other types of foot strikes are "midfoot," where the runner lands on the center of their foot, and "forefoot," where they land toward the front of their foot or on their toes.

Heel striking has a bad reputation because it can create a repetitive landing force that can travel through the leg and slowly damage your knees and hips. It can also have a braking effect, which can slow a runner down with each stride, as opposed to the forward gliding motion that can be achieved with midfoot and forefoot strikes.

How can you determine your foot strike?

The best way to go is to get a professional gait analysis. They are often provided by running specialty stores and physical therapists. You can try shooting video of yourself, but this can be tricky as multiple angles are needed to get the entire story, and you may not know what to look for.

There are training sensors you can use to measure certain aspects of your foot strike. For example, Runscribe+ footpods can track the braking force of your right and left feet independently. Seeing higher numbers here can be a sign of a troublesome heel strike. This data can be analyzed in SportTracks with all of your other training metrics.

What do physical therapists say?

According to the PT's we reached out to, you should mainly focus on where your foot lands in relation to your body. "I am less concerned with which part of our foot we are striking with and more concerned with where that foot is striking the ground in reference to the body," says Sam Ray, from Upright Athlete Physical Therapy.

"For example, someone who heel strikes out in front of their body is at a higher risk of injury because of the increase in forces through that leg from the heel to the hip. Stress fractures of the tibia, IT Band syndrome, and patellofemorial pain are all common. Heel strikers are more likely to land out in front of their bodies. However, if that same person heel strikes with their foot directly below their body, they are now better able to handle the load and dissipate forces."

I see LOTS of runners who heel strike and do not have injuries.

Evan Adler from UNC Healthcare agrees, "While it is true that it is not the preferred way for runners to hit the ground, it is not inherently the cause for injuries. I see LOTS of runners who heel strike and do not have injuries. With that said, when a runner comes in for treatment for an injury, if I see that they are a heel striker, then I do try to help remedy that."

Training to improve foot strike

What can be done to reduce the damaging impact of heel striking? As it turns out, training to increase cadence is a popular solution, but the overall goal isn't to alter how your feet hit the ground. According to Shefali Christopher at Elon University Department of Physical Therapy, "...cadence is used to decrease load (impact) not strike pattern."

Cadence is the number of steps you take per minute when you run. We cover this topic in detail in our What is Good Running Cadence article, but the basic idea is to train to run with a higher cadence, generally 165 steps per minute or higher. The faster you turn over your feet, the smoother and less physically jarring your run becomes. 

"It is well documented in the research that as little as a 5-10% increase in one’s cadence can have a multitude of effects on gait mechanics, ground reaction forces, joint stress, and injury rates," says Evan Adler.

"Injury is caused when the strike impact, also known as vertical ground reaction force, is too high. Rear foot strikers are traditionally seen to have higher impact than forefoot, HOWEVER, that doesn’t mean heel strike equals injury. It is important to look at forces," says Shefali Christopher.

The takeaway...

Worrying about the angle at which your feet hit the ground is likely unnecessary, as long as damaging forces are not created when you run. You can lessen the chances of having an injury-prone gait by tracking and monitoring your cadence. You should occasionally glance at the cadence number on your watch as you run to make sure it's not too low. If your cadence is low, you will need to start taking shorter and quicker steps to increase it.

The workouts page in SportTracks endurance sports software showing running cadence numbers over time

As you train to gradually increase cadence over time, you can analyze your workout data to determine if the training is paying off. The Workouts page in SportTracks allows you to easily filter all of your runs by date, and then compare specific metrics chronologically. Looking at a stack of your average cadence numbers will provide valuable insight.

Thanks for checking this out! You can learn more about this topic in our articles about Running Form 101, How to Improve Running Cadence, and Foot Strike and Shoe Choice.

Training
https://cache.sporttracks.mobi/blog/images/2020/09/heel-strike-runner-illustration-cover.jpg

Garmin Forerunner 745

$
0
0

The new Forerunner 745 is the latest multisport watch from Garmin, but it will likely appeal to more than just triathletes who want a lightweight yet powerful device. It features a built-in altimeter and a blood-oxygen monitor that make it an excellent option for the endurance runner, swimmer, or cyclist who also likes to ski and hike deep into the wilderness. Plus, it has some new and genuinely useful capabilities that have never been included on a Garmin sports watch before. Let's dig in...

To fully understand the Forerunner 745, you need to first identify where it stands in Garmin's product lineup. It exists as the mid-level multisport watch, with the Forerunner 945 and premium Fenix 6 series being above it, and the 4.5 year old Forerunner 735XT remaining as the entry-level option. Weight weenies take note: the new 745 is both smaller and more lightweight than both the Forerunner 945 and Fenix watches. Every gram counts in long events, and the 745 will save you a few.

The Garmin Forerunner 745 multisport watch in different colors

What's new in the Garmin Forerunner 745?

Even though the 735XT is still available, the Forerunner 745 stands as its replacement, and the update is substantial. Instead of flattening out on the top and bottom, the new 745 features a fully round display with a durable Corning Gorilla Glass DX lens. It has storage for up to 200 hours of activity data (up from 80), plus the ability to store and playback music to Bluetooth headphones. A Garmin Pay NFC chip is also present for making contactless payments, which is quite a useful thing these days.

One of the standout features are the Daily Workout Suggestions. Every day the 745 will suggest specific workouts based on your current fitness level. The activities will be different for each of the various sports modes, from indoor cycling to open-water swimming, but the overall goal is the same — to provide the most appropriate intensity level based on your present physical state. This is the first Garmin watch to get this compelling new feature, and surely not the last. In fact, it was already added to the Forerunner 945 in a recent firmware update.

Another feature that debuted with the 745 but was quickly added to other Garmin watches is a new Track Run mode. This provides much more accurate distance measurements and maps when you work out at the running track. A couple of laps as a warmup helps the 745 nail down the specifics of your track, after that it nails the metrics of your workout — down to the specific lane you ran in.

The Garmin Forerunner 745 multisport watch with the pulse ox screen

Another update to the 745 is the inclusion of the Garmin Elevate optical array with a heart-rate monitor and Pulse Ox sensor. The latter measures blood oxygen saturation, which can provide more accurate and detailed sleep-tracking data, and tell you how your body is acclimating when working out in higher elevations and altitudes.

How is the Garmin Forerunner 745 different?

What makes the Forerunner 745 a multisport watch is that it has activity profiles for triathlon and swimrun. These, in addition to open-water swimming, are not found on the more affordable yet powerful Garmin Forerunner 245. However, these features are not needed by everyone. In fact, many people found the Garmin Forerunner 245 to be appealing but wished it had a built-in altimeter. Why? So it could provide specialized data, such as:

  • Reliable altitude information during hikes
  • Detailed ski-run data
  • Compatibility with Garmin Running Power

The inclusion of a built-in altimeter on the new Forerunner 745 makes this new watch an excellent solution for this type of user, without needing to jump up to the more expensive Forerunner 945. And of course, running power data, skiing workouts, and hikes that you've tracked are all fully supported in SportTracks. The 745 also provides advanced VO2 Max prediction and Training Effect data, both of which you can analyze in SportTracks. 

The 745 has full access to Garmin's Connect IQ app ecosystem, which means there are hundreds of apps, data fields, and watch faces available for it. But this model ships with a new kind of face that displays your current training load status. Being able to see your training load every time you glance at your watch is a thoughtful use of training data.

It should be noted, however, that this will only be based on stimulus recorded by Garmin. If you also track workouts with other brands of bike computers, rowing machines, fitness apps, and others, the fitness level displayed will be incomplete. This is where a platform like SportTracks is truly beneficial. It pulls data from a variety of sources to assemble the most accurate fitness and fatigue charts possible, and allows you to enter in races and other events so you can easily visualize when your performance will peak.

The Training Load and Performance charts in SportTracks endurance sports training software showing a race marker for the Boston Marathon in the charts

All told, the new Garmin Forerunner 745 is an excellent all-around multisport watch. It provides extended battery life for long workouts and races, and is loaded with advanced capabilities and fitness sensors Plus, you'll appreciate its compact and lightweight body on your many endurance workouts. If you need full mapping for navigation and a sleek metallic body that pairs well with business attire, you need to look elsewhere. Otherwise, the 745 looks like a winner. 

Community
https://cache.sporttracks.mobi/blog/images/2020/10/garmin-745-watch-and-swimmer-cover.jpg

Track Running Etiquette

$
0
0

At its core, running is simple: you throw one foot in front of the other and plod along. Things can get a little more complicated when many runners share the same space, such as at a running track. However, if you follow a few unwritten rules, you will have a smooth experience. Everything you need to know is in this post below.

Why run at the track? It's a chance to concentrate on running form and pace without needing to slow down for traffic or tree roots on trails. Many tracks have special coatings that add spring to your step and lessen impact forces. It's always beneficial to mix up your workouts, so visiting the track a few times a month will only make you stronger. Lastly, it's not a place reserved for elite runners, the track is for everyone.

A male runner on a running track at sunset

1) Try to find the written rules

This post focuses on the unwritten rules of the track, but many facilities have rules of their own. For example, the track in our city has designated "community hours" when anyone can show up and run, and times that are exclusively reserved for specific teams and clubs. Search for this information online before you arrive, and look for signage when on site.

2) Run counterclockwise on the track

The most important rule to remember is the direction to run: counterclockwise (or anti-clockwise). If the track is empty when you arrive, you may be tempted to start running in the direction that has the most allure at the moment, but always make a point of running counterclockwise. If everyone is already running clockwise when you arrive, it's better to join them to avoid collisions, but in general, counterclockwise is the best choice.

3) When running, use the innermost lane

The innermost lane, or the lane all the way to the left when running counterclockwise, is reserved for people who are running. You can use this lane even if you're moving at a slow pace. When it's time to take a rest or a walk, be sure to move to the outer lanes to clear the way for active runners.

4) Always remain aware of other runners

The track is a shared space. Show your community the respect it deserves by always staying aware of the other runners. When entering or exiting a lane, be mindful that you're not cutting off another runner. Listen for other runners approaching from behind, and keep an eye on the whereabouts of the others as you make your way around. Using headphones can inhibit your ability to remain mindful of the other runners.

5) Pass with care and get passed gracefully

Since active runners will be using the innermost lane and running counterclockwise, faster runners will pass on the right. They must be careful not to startle the slower runner or cut them off when they reenter the innermost lane. If the faster runner wants to remain in the innermost lane, they will yell "Track!" as they approach, at which point the slower runner must move to the right.

6) Don't come to a complete stop

While it's common for olympiads to collapse on the track after crossing the finish line, this is poor behavior at the community track following a routine workout. Lanes are for those in motion. When you need to come to a complete stop, move to an appropriate area off to the side. Respect the field as well. Don't nap on the pole vault mat or take a refreshing dip in the steeplechase water jump.

The workout detail page of SportTracks endurance sports software showing a running track workout

Data from a threshold track-running workout in SportTracks

More tips for running track...

  • Consider counting your laps. A complete loop is 400 meters and 4 laps equal a mile. While it's strongly advisable to record your workout with a running watch or a mobile app so you can analyze heart-rate data and other metrics, GPS accuracy can struggle with the tight and exact nature of the course. Staying aware of your laps and times will provide accurate distance and pace.
  • You can greatly improve the accuracy of your running watch by using a footpod sensor and assigning it the role of capturing pace, distance, and cadence in your watch. The Stryd footpod is an excellent option that doesn't require calibration, however it is expensive. When choosing a footpod, be sure to first verify that it's compatible with your watch.
  • The track is the perfect environment to execute specific tests to determine your current fitness level. If you run with a heart-rate monitor, you can perform an LTHR test. This will provide your Lactate Threshold Heart Rate and your Functional Threshold Pace. Both of these metrics represent the maximum you can consistently maintain for one hour. You can repeat this test every six weeks to see if your training is being effective.

Thanks for checking this out! You can learn more about endurance sports training in our Heart-Rate 101 and Running Form 101 articles. 

Training
https://cache.sporttracks.mobi/blog/images/2020/10/track-etiquette-runner-cover.jpg

Best Budget Smart Trainers 2020

$
0
0

Choosing the best affordable smart trainer for indoor cycling can be extremely difficult because there are a vast number of models available, and researching takes an incredibly long time. That's why we publish this article every year — we provide the information you need in an easy-to-read, efficient format.

The pandemic has made this process even more difficult. Indoor bike workouts were already gaining popularity before the virus, and then lockdowns and social distancing sharply increased the demand for at-home fitness equipment. Now several of the best options are frequently out of stock. To make up for this, we provide three recommendations in each category so there's a better chance that you'll find a model you can actually buy.

A male cyclist riding an indoor bike trainer in a kitchen

Just want a better indoor bike workout?

This article focuses on "smart" trainers, meaning they have high-tech sensors and wireless protocols that make it possible to use them interactively with cycling software. But if you're not ready to buy a costly smart trainer and you want an experience that's more fun than blindly grinding away, you can use engaging apps like Zwift, TrainerRoad, and Peloton by connecting your bike to a "dumb" trainer and attaching inexpensive speed and cadence sensors.

These trainers are "wheel-on" designs, meaning you attach them to the rear wheel of your bike. Dumb or "classic" bike trainers use magnets or fluid to create tension. Magnetic bike trainers are less expensive, but they quickly lose inertia when you stop pedaling and they're significantly noisier. That's why all of the models we recommend are fluid based. To use Zwift or TrainerRoad, you just need a speed sensor. To use the Peloton app, you just need a cadence sensor. We recommend the speed and cadence sensors made by Wahoo because of their ease of use and that they provide both Bluetooth and ANT+ wireless communication.

The Saris Fluid2, Kurt Kinetic Road Machine, and Saris CycleOps Fluid bike trainers

Kurt Kinetic Road Machine - This bike trainer has a firmly established reputation for being solidly built and providing smooth and quiet operation. It's our top pick for budget-friendly classic trainers as it supplies excellent performance and long lasting value at a great price. However, the Kurt Kinetic Road Machine is bundled with an included speed sensor that tends to be inaccurate, so buying separate Wahoo sensors is recommended so you can have the most beneficial workouts possible.

Saris Fluid2 - With consistently positive reviews from users year after year, the Saris Fluid2 is our second recommendation for classic trainers, mostly because it tends to cost a little bit more than the Kurt Kinetic Road Machine. The Fluid2 has a durable build quality and folds-up compactly for transport and storage. Like the Road Machine, the Fluid2 is often bundled with a speed sensor, but it also tends to be inaccurate, so buying Wahoo sensors separately is still recommended. 

Saris Fluid - This classic trainer is very similar to the Fluid2. The price is $50 USD cheaper and it's similar in design, however the build isn't quite as robust and it doesn't fold down as compactly. The Saris Fluid has a PVC roller (the Fluid2 roller is anodized aluminum), and it's a bit louder when in use. It's our third pick because it offers good performance at a low price. No sensors are included with this unit, so this is something you will need to purchase in order to use cycling software.

Important wheel-on trainer tip: Due to the heat created by the roller, this kind of trainer will quickly wear out a regular bike tire, so we strongly recommend using a dedicated trainer tire.

The best entry-level cycling smart trainers in 2020

The classic trainers covered in the first section cannot increase resistance on-the-fly, so to do a more intense interval, you need to shift your bike into a harder gear and pedal with more force. On the other hand, smart trainers can increase resistance without you doing it manually. When you start climbing a virtual hill in cycling software, a smart trainer will automatically make you do extra work to spin the cranks. This greatly enhances the indoor riding experience and makes it possible to target intensity ranges for specified training.

Like the classic trainers, entry-level smart trainers are all wheel-on designs, meaning they attach to the rear wheel of your bike. They are typically louder when you ride them compared to "direct-drive" trainers that are covered in the next section. Also, keep in mind that the least expensive entry-level smart trainers provide fitness data that isn't as accurate as more advanced models.

The Tacx Flow Smart, Wahoo KICKR Snap, and Elite Tuo bike trainers

Tacx Flow Smart - For the third year in a row the Tacx Flow Smart is our pick as the best entry-level smart trainer. It just strikes the right balance of having a low price with decent performance. Unlike the classic trainers in the first section, the Flow Smart supplies speed, cadence, and power data without additional sensors. However, these metrics will be more accurate with the direct-drive models recommend in the next section. The Tacx Flow Smart provides a maximum resistance of 800 watts, a simulated uphill grade of 6%, and an accuracy of +/- 6%.

Wahoo KICKR Snap - This trainer is significantly more expensive than the Tacx Flow Smart, but it's also significantly better. There's only one truly inexpensive smart trainer on the market, and that's the Tacx Flow Smart. The KICKR Snap has a stronger build quality, a much heavier flywheel that provides a more realistic riding feel and better inertia, and more accurate metrics across the board. However, thanks to the pandemic, it's often out of stock. The Wahoo KICKR Snap provides a maximum resistance of 1500 watts, a simulated uphill grade of 12%, and an accuracy of +/- 3%.

Elite Tuo - The Elite Tuo is the most recently designed model included in this entire article. It's impressive because it provides the performance of a high-quality trainer at a somewhat entry-level price. It's a little more expensive than the Wahoo Snap in some markets, but definitely worth considering. Besides its excellent performance, the Tuo also features a design that will blend in more harmoniously with the living spaces of your home. The Elite Tuo provides a maximum resistance of 1250 watts, a simulated uphill grade of 10%, and an accuracy of +/- 5%.   

The best mid-range cycling smart trainers 2020

Mid-range smart trainers are all direct-drive machines, meaning that you need to remove the rear wheel of your bike to attach them. This reduces unnecessary wear-and-tear on your rear wheel, and it makes the riding experience less noisy, more realistic feeling, and supplies much more accurate training metrics.

Competition in the mid-range trainer market has heated up significantly in the past year, so you can be assured that any of the following recommendations will supply great performance. Mid-range trainers are the sweet-spot for indoor cycling. You get an excellent training machine at a price that's significantly lower than the premium models that are featured in the next section.

The Tacx Flux S, Elite Suito, and Wahoo KICKR Core bike smart trainers

Tacx Flux S - We decided to rank our recommended mid-level smart trainers based on price, which is why we're putting the Tacx Flux S first. It's the least expensive of the three, yet it still delivers a solid riding experience with accurate data. It's not the most silent direct-drive trainer on the planet, but the noise that it makes when you're pedaling isn't terribly loud or disruptive. The Tacx Flux S provides 1500 watts of maximum resistance, an uphill simulated grade of 10%, and an accuracy of +/- 3%.

Elite Suito - This model costs a little bit more than the Tacx Flux S, but to its great credit it comes with an installed cassette, which you need to purchase and install yourself (or have a local bike shop do it). You also need cycling-specific items to install a cassette like a lockring removal tool and a chainwhip. The idea with the Suito is to provide a high-quality mid-level trainer that you just pop out of the box and start riding without fussing with assembly. The stats are also a notch above the Flux S, with the Suito providing 1900 watts of maximum resistance, an uphill simulated grade of 15%, and +/- 2.5% of accuracy.

Wahoo KICKR Core - The main thing you need to know about the Wahoo KICKR Core is that it provides nearly the exact same riding experience and accuracy of the top-of-the-line Wahoo KICKR which costs $300 USD more. The main thing that's different about the Core is that it has a less adjustable stand and that it lacks a handle to more easily pick it up. The ride is near silent, and it's compatible with the Wahoo KICKR Climb unit which moves your fork up and down to simulate ascents and descents. The Core provides 1800 watts of maximum resistance, an uphill simulated grade of 16%, and an accuracy of +/- 2%.

Important direct-drive trainer tip: Most direct-drive trainers do not include a cassette (with the exception of the Elite Suito in this case). You can learn more about how to choose one and the tools you need to install it in our Build the Perfect Pain Cave post.  

The best high-end cycling smart trainers 2020

If mid-level smart trainers deliver such a great ride at a lower price, why even bother considering high end? When you get up into this category, you're dealing with the most advanced smart trainers ever made. They are even quieter when in use, provide the most accurate fitness data, and some of them have novel capabilities that make indoor cycling even more engaging.

The Saris H3, Tacx Neo 2T, and Wahoo KICKR 2020 cycling smart trainers

Saris H3 - Our goal is to suggest "budget" cycling trainers, but this gets convoluted in the high end, but the Saris H3 truly is a premium smart trainer that's priced competitively. It's slightly louder than the other two nearly silent high-end trainers in this category, and it doesn't vibrate when you ride over virtual cobblestones like the Neo 2T, and it can't be used with the Wahoo Climb like the KICKR, but it does deliver an otherwise top-tier indoor cycling workout for a few hundred dollars less. The H3 provides 2000 watts of maximum resistance, an uphill simulated grade of 20%, and an accuracy of +/- 2%.

Tacx Neo 2T - When you spend a long time reading reviews written by real people who own the Tacx Neo, you get used to sentiments like "...this was the best cycling purchase I've ever made." The only knock against this model is that it isn't compatible with the Wahoo KICKR Climb accessory. Everything else about it is best-in-class. The 2T is the latest version which features improved internal components and left/right pedal stroke analysis, but if you can find a deal on the original Neo or the Neo 2, they are both excellent machines as well. The Tacx Neo 2T has a maximum resistance of 2200 watts, an uphill simulated grade of 25%, and an accuracy of +/- 1%. 

Wahoo KICKR 2020 - Of all of the smart trainers in this guide, the Wahoo KICKR is among the most iconic and beloved. The latest 2020 version features new AXIS feet that allow your bike to slightly rock side-to-side for a more realistic ride feel. This is one of the few smart trainers that ships with a cassette installed, and another way that it's different from the more affordable KICKR Core is that its flywheel weighs 16 lbs (7.25 kg), which is 4 lbs more (1.8 kg) than the Core. The KICKR 2020 has a maximum resistance of 2200 watts, an uphill simulated grade of 20%, and an accuracy of +/- 1%.

Great ways to use your indoor trainer

There are several excellent online cycling services that you can use with your bike trainer which require a monthly or annual fee, such as Zwift, TrainerRoad, SufferFest, the Peloton app, Rouvy and more. Some of these have free trial periods where you can test them out before you subscribe. There's also a virtual riding app called RGT Cycling (which stands for Road Grand Tours) that has a free tier. All of these platforms are worth trying to see which one suits you best.

Creating a custom structured indoor cycling workout in SportTracks endurance sports software

Creating a custom structured smart-trainer workout in SportTracks

A high-quality cycling workout generally consists of a warm-up period followed by short, medium, or long intervals of higher intensity with recoveries after each one, and a cool-down period at the end. It's actually rather easy to create your own custom cycling workouts and then use them in a bike computer or a sports watch to control your smart trainer. They can be made in SportTracks and easily loaded into devices that offer ANT+ and FE-C connectivity, such as the Wahoo ELEMNT Bolt and Roam, the Garmin 530, 830, and 1030 bike computers, and the Forerunner 945 and Fenix 6 watches. You can quickly create an entire reusable library of these workouts in SportTracks, and they will automatically be sent to Garmin devices when placed in your calendar.

SportTracks also provides advanced gear-tracking features, which is useful for indoor cycling equipment because it takes a beating. If you're serious about competitive cycling, can be helpful to know how many miles you can put on a rear cassette before it starts skipping. SportTracks makes it easy to track all of the separate parts of your indoor cycling setup individually, as well as each component of your outdoor bikes and other fitness equipment.

Get more information about cycling trainers

The point of this article is to recommend high-quality, budget-friendly bike trainers, but there's a lot more to these products than we can cover here. Thankfully, there's a dedicated endurance sports-tech reviewer who does an exceptional job of clarifying all of the fine details of these products. We're talking about Ray Maker, creator of the excellent DC Rainmaker blog. If you want to learn more about these products, that's the best website to visit.

Thanks for checking this out, we hope it was helpful! Be sure to have a look at our other articles about indoor cycling.

Image credit: kitchen cyclist photo by Michael Lokner

Community
https://cache.sporttracks.mobi/blog/images/2020/11/best-cycling-smart-trainers-photo-kitchen-cover.jpg

2020 Year In Review

$
0
0

When the year gets close to the finish line, we like to look back at how our world of endurance sports is changing and evolving. Last year we noticed a growing interest in running power meters, and how the Nike VaporFly Next% were the darling of sports media yet the most popular running shoes among the SportTracks community were completely different.  

Now we've taken a look at how things have changed this year. You do not need to be told that 2020 was unusual. As you can imagine, things have shifted dramatically over the past 12 months. In some ways the numbers are shocking — but in a bigger way they show resilience and the utmost commitment to health and fitness. As always, privacy is a top priority at SportTracks. All of the data used to create this post was strictly anonymized.

A chart showing a 50% decrease in the number of endurance sports races from 2019 to 2020

Number of Endurance Sports Races 2019 vs 2020

The number of races that the SportTracks community participated in during 2020 compared to 2019 decreased by a whopping 50%. While this is startling at first, when you factor in that the majority of in-person races were cancelled starting around March 15th and onward, it becomes clear that this percentage could be much larger. Just 75 days into 2020 the races were terminated, yet the number of people who committed to safely competing in virtual races and other socially distanced challenges proved to be strong.

A chart showing the increase of indoor cycling workouts in 2020 compared to 2019

Number of Indoor Bike Workouts 2019 vs 2020

Indoor cycling has been gradually increasing in popularity over the years, but 2020 brought a sharp increase in the overall number of these types of workouts. This shouldn't come as a surprise. Fitness equipment that can be used at home was in hot demand from the beginning of the pandemic, and it continues to be a Furby-like sensation today. Indoor bike riding can deliver a fantastic cardio workout — if you were lucky enough to find a cycling smart trainer that was available to purchase.

A chart showing the number of runs in 2020 that had running power data

Running Power Meter Usage in 2020

In 2020, we witnessed a bit of a plateau in running power meter usage. It had grown around 4% per year in 2018 and 2019, while 2020 only brought an increase of 1%. Don't lose faith in this trailblazing metric, though. It was included on several new watches in 2020, the Stryd footpod with built-in wind detection is better than ever, and in a comment on his blog, Ray Maker recently hinted that Garmin may be adding running power to the native ANT+ and Bluetooth stack. The5krunner has also recently predicted that Garmin has big running power features in the works. This type of newfangled fitness data is still just getting started.

A chart showing the most popular running shoes in 2020 with Asics as the leading brand

Most Popular Running Shoes of 2020

If you thought runners were stuck in their ways and always stayed loyal to the same shoe brands, this year's chart may make you rethink your position. We're happy to see that the advanced gear-tracking features in SportTracks are more popular than ever, and Asics should be happy as well, as they've held on to their #1 rank for the second year in a row by a healthy margin. The battle for second place was closely fought in 2020, with Saucony beating Nike by a nose. Last year Nike sat squarely in fourth place, and Hoka One One didn't even make it in the top five.

The Top 5 Running Shoe Models of 2020

Like last year, our list of the top 5 running shoe models doesn't perfectly match our list of the top five shoe brands. This is because our data isn't perfect. Not everyone enters in the specific model of their running shoes, which influences how we can rank them. But, in case you're curious, here are the most popular running shoe models with the anonymous data we do have.

The Brooks Ghost 12 running shoe

First Place: Last year this shoe landed in third place, but in 2020 the Brooks Ghost 12 narrowly beat the second-place contender. The Ghost 12 is a soft and comfortable road running shoe that's ideal for easy and mid-tempo long runs.

The Saucony Kinvara 10 running shoe

Second Place: The previous version of this shoe model was the most popular choice last year. The lightweight and neutral Saucony Kinvara 10 made a strong showing in 2020 as well. This shoe is a great choice for long and fast training runs and races.

The Hoka One One Clifton 6 running shoe

Third Place: Overly cushioned with an incredibly soft upper yet still retaining an overall lightweight feel, the Hoka One One Clifton 6 road running shoe was the third most popular model of 2020. It provides a comfortable run that eases some of the impact of the road.

The Salomon Speedcross 4 trail running shoe

Fourth Place: The Salomon Speedcross 4 is the only trail-running shoe in the top 5. It's at home when running on loose ground, mud, and snow. The Speedcross 4 provides excellent traction when going uphill and down, and the fit gives you confidence even when wet.

The On Cloudflow running shoe

Fifth Place: On the other end of the spectrum, the On Cloudflow is very much not at home in the mud. This is strictly a road-running shoe. It's lightweight and ideal for fast runs and races. It doesn't like trails but it handles wet pavement well providing excellent traction.

Thanks for reading this post! If you want to learn more about the different types of running shoes available, check out our Foot Strike and Shoe Choice article.

Community
https://cache.sporttracks.mobi/blog/images/2020/11/trends-2020-masked-woman-running-cover2.jpg

Endomondo Features Live On

$
0
0

If you're upset that Under Armour is permanently shutting down the popular workout-tracking app Endomondo, you should know that many of the most-loved features in Endomondo are also available in SportTracks. For example...

Personal Records in Endomondo

Endomondo listed your personal records on its dashboard, and you could add your personal bests from other sports below it. This was a very popular feature and something that generally isn't provided on other platforms.

The Personal Records chart in Endomondo

SportTracks has something very similar, but with a lot more versatility. It lets you quickly filter your personal records by sport and date, see your records on a timeline, and check out your best workouts, best months, and best years. If your fastest 5k happened during a 10k effort, you'll see it here. 

The Personal Record Timeline in SportTracks endurance sports software

You can load your entire workout history from Endomondo into SportTracks using services like Tapiriik, RunGap, and FitnessSyncer. When you do this, you can explore your Personal Records Timeline to see if you have any achievements that have gone unnoticed.

Heart-Rate Zone Charts in Endomondo

Another popular feature in Endomondo were the heart-rate charts that showed the amount of time you spent in each zone during a workout. You could adjust the zone ranges in the settings to personalize the charts to your correct fitness level.

The heart-rate zone chart in Endomondo

The same functionality is in SportTracks! Every workout has an Analysis tab that displays heart-rate zone data. Selecting the menu next to Heart Rate lets you change this zone chart to Pace, Cadence, Grade, Power, and more. Selecting the Compare tab will match an equivalent workout from your history so you can see if you've improved.

The heart-rate zones chart in SportTracks endurance sports software

There are many more features that seemed like they were exclusive to Endomondo but are also in SportTracks, such as:

Workout Merge - If your watch, bike computer, or tracking app crashes before you finish a workout, Endomondo let you merge two workouts as one. SportTracks lets you do the same thing, and it also lets you trim the beginning and end of your workouts.

Workout Sorting - Endomondo made it easy to see a list of all of your workouts from a specific sport, such as running. SportTracks does the same, but takes it to the next level. You can quickly filter your workouts by date, sport, calories, and more. You can even sort workouts by specific running shoes or other gear that you're tracking.

Workout Editing - People enjoyed the workout editing features in Endomondo, but SportTracks offers the most powerful editing features in the industry. You get full control of Time, Distance, Speed, Pace, Calories, Heart Rate, Elevation, Location, Laps, and much more. 

Weather Data - If you liked checking out the weather conditions in Endomondo, you should know that every workout in SportTracks that has GPS data automatically gets detailed weather information applied to it.

How is SportTracks different from Endomondo?

Even though SportTracks has many of the same features as Endomondo, they are different in one fundamental way: with SportTracks, you use hardware devices like watches and bike computers to record your workouts, or you can record your workouts with free mobile apps like Polar Beat and the Suunto App, both of which are available on Apple's iOS and Android.

SportTracks has seamless auto-sync integrations with Garmin, Polar, Suunto, Wahoo, and many other popular brands. As soon as you finish tracking your workout, the fitness data is automatically loaded into SportTracks. You can access your SportTracks account on any computer, tablet, or smartphone to analyze your workout data, plan your training calendar, create structured workouts and more. Sound good? Use every feature with this 45-day trial.

Endomondo® is a registered trademark of Under Armour® or its subsidiaries.
Zone Five Software is not associated with Under Armour® or its subsidiaries.

News
https://cache.sporttracks.mobi/blog/images/2020/11/endomondo-features-logos-cover.jpg

COROS Compatibility

$
0
0

We're happy to announce that SportTracks now fully supports auto-sync with COROS watches! This feature supports the PACE, APEX and VERTIX models.

To get started, install the COROS app on your phone and connect your app with an account on the coros.com website. Next pop over to the SportTracks website, click your profile photo in the upper right corner of the website and click the "My Account" button to view your account settings.

Click the "Sharing" tab on the right, then hit the "+Connect" button.

On the next screen select the COROS icon.

From there you will be brought to a page to authenticate yourself. This may require logging into the COROS website. When logged in, you will be asked to give SportTracks permission to access your COROS account. Click the "Authorize" button. Lastly, select the "Finish" button and you're done!

When you finish a workout on your COROS it will be uploaded to your phone app. From there it will be sent to the coros data center and then synched over to SportTracks within a few minutes. Once the workout has been synced to SportTracks you can edit or annotate the data or use it for advanced analysis.

How To
https://cache.sporttracks.mobi/blog/images/2020/11/coros-cover.jpg

Understanding Bike Trainer Tech

$
0
0

The basic concept behind bike trainers is easy to understand: it's a device that you attach to a bike so you can ride indoors in a stationary manner. They are deceptively simple from afar, but when you take a closer look you realize there's a lot to learn. Thankfully, by the end of this article you'll know esoteric facts like the difference between magnetic and fluid resistance, the benefits of ANT+ FE-C support, and a lot more.

Indoor cycling trainer types

It's important to understand the difference between "wheel-on" and "direct drive" trainers. As the name implies, wheel-on trainers physically attach to the rear wheel of your bike. With a direct-drive trainer, you must remove the rear wheel and then attach your bike frame to the trainer.

A graphic showing the difference between a wheel-on and a direct-drive indoor bike turbo trainer

The advantage of wheel-on trainers are that they're more affordable and they weigh less, so they're easier to transport. Direct-drive trainers are more expensive but offer many advantages. They're less noisy when in use. They have a more realistic riding feel, meaning when you stop pedaling they provide a simulated feeling of inertia, whereas a wheel-on trainer will slow down much more quickly. Direct-drive trainers don't cause any wear-and-tear on your rear wheel, whereas wheel-on trainers do. Direct-drive trainers also require much less calibration, whereas wheel-on trainers must be calibrated before each workout.

Whether you ultimately get a wheel-on or direct-drive trainer, it's important to track the usage of your equipment. Indoor cycling typically mixes gear that you use outdoors with items that you only use indoors. Keeping accurate records of how much your equipment has been used can help you avoid mechanical problems in future training rides and races. SportTracks offers incredibly robust yet easy-to-use gear-tracking tools, and you can learn the specifics of indoor cycling gear tracking in our Pain Cave Gear Tracking post.

Types of indoor bike trainer resistance

The purpose of indoor bike trainers is to simulate outdoor riding and to get a workout, but these things only happen if you add some resistance to the cranks. Trainers handle this in the following ways: 

Fluid - As we pointed out in our Best Budget Bike Trainers guide, the best entry-level wheel-on trainers all have fluid resistance. These trainers feature a fluid-filled container. When you push the pedals, a flat-bladed propellor spins in the container. The faster you go, the more resistance is created.  

Magnetic - You guessed it! Magnetic forces are the source of resistance with this type of trainer. More specifically, a flywheel (a weighted disc that uses momentum to maintain velocity) passes through a magnetic field. Resistance can be raised or lowered with a manual control.

Air - These are similar to fluid-resistance trainers. When you turn the pedals, a fan moves in a chamber, and air causes the resistance. Again, the faster you turn the pedals, the more resistance will be created.

Rollers - Rollers are an older type of indoor trainer that are still in use today. They are more simplistic metal frames with a set of rolling drums that you must skillfully balance your bike upon. Resistance only comes from the weight of your body and bike, and the gears you chose. There are a couple of "smart roller" trainers available that add resistance, but they are uncommon.

A road cyclist rides on indoor rollers

Air, fluid, and magnetic resistance are used in different kinds of wheel-on trainers, whereas direct-drive trainers typically have a heavy flywheel with electronically controlled magnetic resistance. How resistance is applied is what separates classic trainers from smart trainers. Classic trainers don't have electronics, whereas smart trainers wirelessly provide control of cycling power, and they simulate the resistance of hills. Instructions for this control comes from apps, bike computers, sports watches, and virtual cycling platforms. 

Smart Trainer Technology

There are several wireless protocols that facilitate a two-way communication between smart trainers and other devices, such as bike computers, mobile cycling apps, sports watches and more. This is how the smart trainer gets control instructions, like how much resistance to apply. It's also how the smart trainer sends your fitness data (such as speed, cadence, and power) to the other device to record the workout. It's important to know which wireless protocols your trainer supports. Familiarize yourself with the protocols below and you will have the required knowledge.

The ANT+ logo

ANT+ - This is a wireless communication protocol that was developed with the specific needs of sports and fitness in mind. Think of it as being similar to Bluetooth, but found almost exclusively on fitness gadgets. It's extremely beneficial when your smart trainer supports ANT+ because it means it will be compatible with a wider range of external fitness sensors and devices. Ideally, you want your trainer to broadcast power, speed, and cadence via ANT+ so it can be received by bike computers, watches, apps, and computers.

The Bluetooth Smart logo

Bluetooth Smart - Bluetooth is one of the most famous wireless protocols on the planet, but what isn't as well known is that it's named after a Danish king who died over 1000 years ago. Make sure the smart trainer you're interested in supports the broadcasting of fitness metrics via Bluetooth Smart, and if it can control smart trainers with Bluetooth FTMS, that's a nice bonus. Like ANT+, your trainer should broadcast power, speed, and cadence via Bluetooth Smart. The best smart trainers broadcast Bluetooth Smart and ANT+ concurrently.

The ANT+ FE-C logo

FE-C - This protocol is commonly referred to as "ANT+ FE-C" and it focuses on the task of controlling smart trainers. If you create a custom bike trainer workout with SportTracks and load it into your bike computer or watch, you can execute the workout on a trainer that supports ANT+ FE-C. This protocol is included in many bike trainers, but not all of them. FE-C support is important to have, so definitely make sure the trainer you're interested in has it.  

Indoor Bike Trainer Fitness Data

Power - This is one of the most important training and racing metrics in cycling. It's a measurement of the strain you apply to the bike when you pedal, and it's used to measure how much energy you're exerting. To get power on a regular bike you need to install an expensive power meter. The majority of smart trainers have simulated power meters built in. It's important that the trainer's power data is accurate, and that it broadcasts power via ANT+ and Bluetooth Smart.

Maximum Incline - This is the uphill gradient percentage that a bike trainer can simulate. In general, the more advanced (and expensive) the trainer is, the higher the incline it can simulate. Separate from cycling power, simulated incline requires a braking force that can add a realistic-feeling climbing resistance at low speeds. 

Cadence - This is the number of times you rotate the pedals in a minute, and it's an important fitness metric. Many bike trainers have cadence built in, but not all. External cadence sensors can be added to your bike to get this data. If you can't afford a smart trainer but you want to train with platforms like Zwift, TrainerRoad, and the Peloton app, you can do so with an inexpensive classic trainer and a cadence sensor. Learn more about the benefits of training with cadence in our What Is Good Cycling Cadence post.

Speed - Speed is self explanatory, but what isn't obvious is that smart trainers often include speed data on the same ANT+ or Bluetooth channel with power. It's always interesting to know how fast you went, but metrics like power, cadence, and heart-rate are more commonly used for structured, specified training. Speaking of heart-rate, bike trainers themselves don't have sensors to capture this data. It's common to wear a separate heart-rate monitor, and to send its data via ANT+ or Bluetooth to the device you're recording the workout on.  

What can you do with smart-trainer fitness data?

It doesn't take too many indoor rides to start accumulating lots of fitness data, which is great because it tells the valuable story of how your performance is progressing. SportTracks calculates unique fitness metrics like Aerobic Efficiency and lets you easily see it in a chronological list with ride data like %FTP and VAM. At a glance you can see if your performance is improving, and what workouts are making the biggest impact. 

Thanks for checking out this article! Be sure to check out our other posts about indoor cycling!

Community
https://cache.sporttracks.mobi/blog/images/2020/12/bike-trainer-tech-bikes-graphic-cover.png

Plan Your Year in SportTracks

$
0
0

Tracking and analyzing workout data is incredibly useful and can help you achieve faster times and new personal records while avoid injuries and burnout, but in order to get there you need to embrace the planning aspect of training — and the best way to do that is to utilize the powerful features in the SportTracks calendar.

Where to start?

At the beginning of a normal year, the first thing to do is to look at the next 12 months and decide which race is the most important to you. This is your "A-Race." In our current pandemic, this can be challenging. Your biggest event could be a virtual race or an individual time-trial effort, or you may be avoiding competitions until 2022. No matter where you stand, planning your workouts is still vitally important. 

One of the major benefits of planning isn't just to perform your best in the current year, it's about building and getting stronger in the years to come. What you achieve in 2021 will be the starting point of what you can do in 2022 and beyond. If your goals begin in 2022, you need to optimize your 2021 training cycles to be primed for success. 

If your dream race is in question in 2021, train intelligently now and crush it even harder in 2022.

Whether your A-Race is this year or you want to create a series of slow-build and recovery cycles in preparation for 2022, the best way to start organizing your training is to plan workouts. If you already have an established fitness routine, formally planning these workouts in your SportTracks calendar opens up an array of actionable insights you are otherwise missing.

Turn your routine into a plan

For example, say you're eight weeks away from starting a training plan. Or conversely, you just want to do your normal weekly workouts over the next eight weeks with a slight increase in intensity, and then have a short recovery period. If you're going to run and ride twice a week, without planning your calendar your training Load and performance charts may look like this:

The Training Load and Performance charts in SportTracks endurance sports training software without planned workouts

Here's what they look like with planned workouts added:

The Training Load and Performance charts in SportTracks endurance sports training software with planned workouts

Now you can clearly see how those workouts cumulatively work to increase your fitness, and using the convenient tools in the SportTracks calendar, you can plan months of workouts in just a couple of minutes.

When you select a future date in your calendar to plan a workout, you can do the basics like choosing a sport with a distance or time goal, or you can get more advanced by adding pace, power, heart-rate, or cadence targets. You can go even deeper by adding structured steps like warm-ups, intervals, and recoveries. Selecting the powerful Repeat tab lets you not only replicate a workout, but also add a gradual increase in intensity over time:

The planned workout screen in SportTracks endurance sports software showing repeating workout options

Planned workouts can be sent to Garmin watches and bike computers automatically by enabling our training integration, and your device will chime and vibrate to guide you through any multi-step workouts you have created. You can also easily export your planned workouts as FIT or TCX files to load into Garmin or other fitness tracking devices.

Embrace strategy and training cycles

With the understanding that each planned workout adds to the rise of your fitness trendline in your training load chart, you may be tempted to continue piling on workouts and increasing intensity until the stats are sky high. Unfortunately, your body will likely respond negatively to non-stop workout stress, and instead of progressing to new heights you will quickly plateau or suffer injury and setbacks.  

A common practice is to structure your calendar based on seasons with intentional, elongated recovery periods between them to let your body partially detrain. This enables you to rebuild your fitness and come back stronger with each successive season. These are the tenets of periodization and other training approaches. In the course of 12 months, you should focus the most intense training and recovery on your A-Race, rather than doing this multiple times in a year.

The calendar in SportTracks endurance sports training software showing training load metrics

You can easily customize the training data you see in the sidebar of your SportTracks calendar to focus on your performance metrics. This way, as you plan your workouts, you will see how they influence your predicted performance in real-time directly in your calendar. Your fitness, performance, and fatigue numbers will also display as weekly summaries in your calendar. These summaries can also easily be switched to display total distance, time, calories burned and more.

The Workout Library in the SportTracks endurance sports training calendar

Your Workout Library can be found under the fitness data on your calendar's sidebar. Any workout you create in your calendar can be dragged and dropped on the Workout Library. This lets you easily use that workout again by dragging it from the library and dropping it on a date. You can also click and drag workouts from one calendar date to another to create a duplicate. 

When you add a race to your SportTracks calendar, that date will be flagged as a visible event on your Health page, so you have a clear understanding of your state of readiness. You want your fitness line to peak close to the race date, with a healthy buffer above your fatigue line. Adding a race to your calendar also adds a countdown timer to your dashboard.

The race countdown timer on the SportTracks endurance sports training software platform

The SportTracks calendar does much more to support your training and racing needs. For example, when you select a date you can write a note, or track an injury. You can go into the sharing settings of your profile and set it to publish your planned workouts to iCalendar. We're always hard at work to make it the most well-rounded and friendly training tool of its kind.

Team SportTracks wishes you a happy and successful 2021 and beyond! 

How To
https://cache.sporttracks.mobi/blog/images/2021/01/plan-your-year-woman-run-cover.jpg

Calories and Exercise

$
0
0

The calorie count of the foods we eat and the benefits of burning them with exercise are something you hear about all the time — yet the actual nuts-and-bolts about how it's all supposed to work are still abstract and mysterious. We wanted to shed light on the basics so we all can have a deeper understanding of calories. 

What is a calorie?

The very foundation of this subject is confusing because calories themselves are not physical elements of food. We're constantly bombarded with advice to choose foods that have fewer calories, but they're not in food at all, they're units of measurement. Calories have a lot more in common with degrees of temperature than they do with fats or sugars.

A graphic illustrations of runners, a hamburger, broccoli, and a carrot,

Food is a source of energy. The nutritional composition of food determines how much energy is provided. If you think of energy as heat, a single calorie is the amount of heat that's required to raise the temperature of one gram of water by one degree Celsius. A single gram of water is equal to around 20 droplets, or a little less than a quarter of a US teaspoon. No matter how you approach it, defining a calorie is esoteric — yet they're constantly in the spotlight in everyday life.

Just as there are 1000 millimeters in a meter, there are actually 1000 calories in a single Calorie (note the capitalization). A diet soft drink that boasts to only have a single Calorie actually has 1000, and a McDonald's Big Mac has an eye-popping 563,000. It's time to hit the gym to burn some of this stuff off!

Caloric Intake and Exercise

The ideal number of calories you should consume each day varies depending on age, gender, size, and activity level. It's typically between 1600 and 3000, and if you take in more than you burn, you can gain weight. No matter what your size and age may be, it's incredibly easy to eat far more than your ideal number of calories per day.

Your body requires a certain number of calories just to carry out the basic functions of life, like breathing and digestion. This amount of calories is your Basal Metabolic Rate, or BMR. "Basal" isn't a scientist's name or the garnish on a pasta entree, it's another word for "base." It's important to know your BMR because it will help you determine the accurate number of calories that you need.

...it doesn't take an overwhelming amount of activity to stay ahead of the calories...

When you know your BMR and other daily caloric needs, it's likely that some weekly exercise will be necessary to burn off your caloric surplus. The good news is that it doesn't take an overwhelming amount of activity to stay ahead of the calories and maintain good health. Most people need to exercise vigorously 3 times a week. These workouts can be 25-minute "easy runs" or jogs, moderate but continuous lap swims, bike rides at a high cadence, or intense sessions of basketball or other aerobic activities. 

Please note that a "vigorous" activity isn't necessarily an uncomfortable amount of exertion. You just need to get your heart-rate up to 75% of your Max HR and keep it there for a little less than half an hour. It sounds more difficult than it is. You can have a conversation at this level of intensity, so don't be intimidated and think you can't do it. 

In addition to these aerobic workouts, every week should also have 3 less demanding activities. They should be 50 minutes a piece and could be long walks, bike rides at a casual pace, non-sedentary yard work, etc. Tracking all of these activities with a GPS watch or a fitness app can help you stay on top of your progress, as well as help you more accurately calculate your calorie burn.

Apple iPhone with a SportTracks calorie goal on its screen

Motivate yourself with calorie-burn goals

Anything you can do to inspire yourself to move is worth a try when it comes to burning calories and leading a healthy lifestyle. With a fitness-platform like SportTracks, you can easily create custom calorie-burning goals. You can set them for a day, week, year, or any span of time that you like. As you progress toward your goal, it will be clear how close you are to hitting it.

Your most current goal will be at the top of your SportTracks dashboard, which you can easily access with any kind of smartphone, computer, or tablet. You can set goals to be calorie-based, or you can create targets based on distance, time, number of workouts, elevation gained and more. You can create general goals, or goals based on specific sport types. Learn more in our Goal Tracking blog post.

The completed workouts summary from SportTracks endurance sports training software

Burning calories across all activities

It can be helpful to get a bird's eye view of your week to see if you're hitting your targets. SportTracks provides calorie-burn data for every workout on your dashboard, in your workout detail pages, on the compare workouts screen, your calendar and more. The card above is a weekly summary from the SportTracks calendar. If you track your bike rides with a different device or app than you track your yoga sessions with, SportTracks brings them all together.

If you use an activity tracker from Garmin, you can utilize this health data in SportTracks. This adds step-tracking, active time, distance, and calories burned to your SportTracks account. Plus, the calories burned data is the total from your activities and BMR. 

Calorie data also provides an excellent way for more advanced athletes to monitor their overall volume metrics. Similar to how you would use TRIMP or Effort data, calorie data can provide an aggregate of various activities, from runs to rides to weightlifting and snow shoeing sessions.

Considering how notorious they are, it's surprising to learn that calories are actually nonmaterial units of measure, and are more akin to hot-water heaters than they are to turkey sandwiches. But it's reassuring to know that if you just follow some basic guidelines every single week, and utilize some specialized tools to keep yourself motivated and on-track, that you can stay healthy, active, and happily fed year round.

Thanks for checking this out! You can learn more about the basics of fitness in our Heart-Rate 101Running Form 101, and Running Pace 101 articles.

Training
https://cache.sporttracks.mobi/blog/images/2021/01/what-is-a-calorie-cover.png

Performance vs. Distance

$
0
0

A similar pattern often occurs when people get interested in endurance sports for the first time. They start out wondering if they have what it takes to complete a 5K, a sprint triathlon, a criterium, etc. When the initial goal is accomplished, they push harder by targeting a longer distance. The focus is the length of the course, not how competitively they are racing it.

By all means, we celebrate those who choose to race long distances at SportTracks, providing that health and safety are prioritized. Most serious athletes put great care into finding their ideal race distance, and sometimes ultra-endurance events are the best choice. But when you look at the racing community on the whole, distance seems like it's often prioritized over speed.

Why is it far less common to strive to improve performance in shorter races? An obvious answer is pain. Trying to outdo your best in high-speed efforts is profoundly uncomfortable. But there's also pressure to go longer that sometimes comes from outside forces, and sometimes within.

A male runner nearing the finish line of a marathon

There's a sense that you'll never truly be a runner if you don't complete a marathon, or you're not a real triathlete until you do a full Ironman. Your family and friends won't fully appreciate the gravity of besting a middle-distance personal record, but they do react to long and demanding distances. Whether you race for yourself or others, distance seems to always win out over performance.

Shorter distance does not mean entry-level

It's understandable why people mistake shorter races like the 5K or sprint triathlon as entry-level events. You can show up at these races without months of training and still cross the finish line with a pulse. The same cannot be said about the marathon or full-course triathlon. If you compete in those events without preparation your suffering is guaranteed, and finishing is unlikely.

The reality is that shorter races are incredibly demanding if your goal is to be competitive — not just a body crossing a finish line. Consider the 50-meter freestyle in swimming, or the 100-meter sprint in track. Anyone can complete those distances, but to be competitive requires an unwavering level of focus and commitment. Bump it up to middle-distance endurance races like the 5K and sprint triathlon, and the discomfort required to be competitive increases exponentially.

A sprint means you need to completely throw down the hammer.

By definition, a sprint triathlon isn't a short race for beginners. A sprint means you need to completely throw down the hammer. It's an all-out effort from start to finish. There is no space to settle into a smooth pace, you've got to give it everything you've got the entire time. The same applies to 5K runs. Sure, you can always go at an easy pace and enjoy the social aspect of the event, but if the point is to be competitive, you've got to push yourself hard for the duration.

If you search the internet for the world's toughest races, you'll quickly find names like Marathon des Sables, The Barkley, and Tour de France. There's no doubt that ultra-distance races are grewling and deserve to be recognized as extremely difficult, but the hard work that's required to be competitive in middle-distance endurance races is far less appreciated. Just because it's overlooked by the general public doesn't mean you should ignore it yourself.

A cure for the post-race blues?

There's an implied sense of progression in endurance sports that seems inexorably tied to distance. Couch to 5K, 5K to 10K, 10K to half-marathon, and so on. You've got to walk before you can run, and once you can run should you keep going until you're competing in 200-mile ultras? At a certain point the all-important progression of distance loses its meaning.

Post-race depression is a real thing, and long distance events are often the culprit. Because it takes months of focus and commitment to train, the non-stop preparation dominates your life. When race day finally arrives and months of your hard work culminate, a sense of listlessness can set in. 

If your driving force had been to push further and further, what are you supposed to do once you've crossed that big finish line? This is when it can be healthy to have a different outlook on shorter races. Finding meaning and reward on shorter courses can stave away feelings of being lost afterward. Your training cycles won't be as lengthy and time consumptive, and your workouts can have more speedplay and dynamism. It's feasible to improve your ranking in your age group, and even strive for the podium. The sky's the limit when you're not bound to bigger and bigger miles.

Training
https://cache.sporttracks.mobi/blog/images/2021/01/performance-vs-distance-race-runner2-cover.jpg

How to Use Training Load

$
0
0

We athletes live in great times where there are abundant devices available with which to measure and collect data about our exercise workouts. Just spend some time on the SportTracks blog and you will see how much technology has become integrated into exercise. When I started doing triathlons in 1988 the only way to know how far I ran in training was to go back and drive the route to measure it. I was always an early adopter of technology and keen to learn from the data and spent many hours transcribing information into spreadsheets.

Fortunately, I discovered SportTracks eight years ago and have been using it in that time to monitor my own training loads while completing in triathlon and running events. I personally have invaluable data to draw on as I seek new goals as a veteran athlete.  I have also been using SportTracks as a coach for five years and the ability to analyse my athlete’s data helps me to be a better coach.  In this article I would like to share the progression of a runner who I have coached for five years using the SportTracks platform as a method to prescribe and monitor workouts. His name is Corey, and he is based in Brisbane, Australia. He has diligently recorded every workout and synchronized them with SportTracks where the workouts have seamlessly been assigned an effort score. His “Performance report” below shows a total of 1679 runs totaling over 17,000km in five years.

SportTracks training load software

I believe the progression of increasing mileage year on year has contributed most to many personal bests (PB’s), rather than any special type of workout. Of course his training plan incorporates interval workouts and long runs, but a lot of zone two running as well. In the five years we have worked together I have seen Corey reduce his 5k best from 19:41 to 15:55, 10k from 39:35 to 33:55 and marathon from 2:59 to 2:46. The SportTracks “Records” chart was a very useful tool for me as a coach to look back and visually see his progression. What makes his current Pb’s even more remarkable is that they were done as solo efforts due to the lack of races in 2020.

Personal Record Timeline in SportTracks.mobi

I think I could count on my hand the number of runners who genuinely would not want to improve their PB’s as Corey has done. Unfortunately, I see the biggest barrier to achieving such progression is a lack of long-term thinking. Running is a hard sport and it can take many years to find your potential. For Corey we are still trying to find his potential and I am hopeful further improvements are possible. I believe he has the potential to lower his marathon below 2hrs40min. For someone who only took up running in his mid-twenties, with a single goal to break 20min at the local 5k race, this would be an outstanding achievement.

While I previously referred to Corey’s training in terms of number of runs and distance, what I am more interested in is an interpretation of these workouts in terms of total training load. There is a lot of scientific research around quantifying training load and one of the best models is TRIMP theory on which SportTracks health monitoring is based. I mentioned earlier that every one of Corey’s workouts has had an effort score calculated for it. By plugging those scores into a beautiful algorithm, SportTracks will calculate both your fitness and fatigue. I won’t go into that here, but I recommend reading an article titledUsing Training Load from back in 2014 that explains it well.

...the biggest barrier to achieving such progression is a lack of long-term thinking.

If you are after the short explanation, the effort score of every workout you do will reflect intensity and duration. A higher effort score will reflect a workout that has stressed your physiology more than a lower effort score. In the context of running, this can be achieved by either running longer, or running faster, or a combination of both. There are many excellent articles on how to achieve that. But for the purposes of this case study, consider that if all the effort scores for all of the workouts are added up then we have an additional metric called training load to analyse.

While gains can be made by repeating the same training load every year, I am skeptical that will lead to your best possible performance. While the internet is loaded with many claims of “secret” workouts that lead to spectacular results, in reality they rarely do. There is nothing wrong with trying different workouts, it makes training more fun, but however you train there is a fundamental principal in exercise prescription called overloading in order to achieve physiological adaptations that lead to better performances. SportTracks provides an excellent visual method to see if you are doing this. As a coach my primary focus is to review an athlete’s long term training load and ensure that it is increasing. This doesn’t always mean that training has to be harder or more painful, the beauty of adaptation is that you adjust to the new normal. In simple terms, you become fitter.

If my claim that by increasing total training load year on year should lead to adaptations, and in turn personal bests, is correct then I should be able to see that in Corey’s data. The chart below shows fitness and fatigue over the five-year period from early 2016 through to January 2021. The macro cycles are easy to spot as peak training load has improved from a score of 1000 back in 2016 up to 1400 in 2020. More importantly, you can see in the chart that more significant progression has been the ability to train at a higher load for longer periods. From the chart you can see that in the early years Corey was able to handle a training load of around 700 for 3 months before cutting back for a variety of reasons. It doesn’t really matter what the reason was, this up and down pattern is typical of an athlete’s year on year cycles as it would take a superhuman to maintain a high load indefinitely. What you can see is that his progression led to the ability to maintain a training load of around 900 for up to 5 months around 2018. This has now progressed in 2020 to develop the ability to maintain a training load of around 1300 for 6 months.

The fitness and fatigue charts in SportTracks

As a coach, my biggest mistake would have been to try and set Corey these big training load targets in the first few years of his journey as a runner, when his motivation to improve was high. I haven’t mentioned yet the importance of balancing fitness and fatigue and how they relate to performance. There is a good article on that called Training Load Example Scenarios. That nature of running is such that most athletes will experience injury. Corey has had two extended periods of injury in five years and it is difficult to say how much excessive training load contributed to that. The human body is like a complex machine and sometimes its limit is found at unexpected times. I like to reframe injuries as a learning opportunity and to reflect on the training load leading up to the injury.

A longer-term focus on monitoring training load also has the positive benefit of knowing how quickly you can return to full training. Apart from the effect of injury downtime, if an athlete’s fatigue levels are controlled by incorporating recovery weeks and end of season breaks, then you should expect that the performance chart to correlate well with training load. I believe this phenomenon can be observed in Corey’s performance chart below. We can see very similar peaks, and durations, for the performance metric, as we saw in the training load chart. I have overlaid some of his PB’s on this chart and not surprisingly the timing of PB’s align with a long period of training load prior.

The performance chart in SportTracks with Personal Records for running

To benefit from this method of analysing your training it is important that you the athlete needs to put some extra time into making sure the effort score recorded in SportTracks is realistic. Don’t worry if it’s confusing at first, with time you will understand it better. Sometimes the algorithm makes a mistake if the data is corrupted due to an erroneous heart rate reading or GPS failure. These can be updated manually by assigning an intensity out of 100% instead. Absolute accuracy is not critical however as we are looking for large patterns of progression, so there is an acceptable margin of error. If you have an inaccurate effort score occasionally the impact on analysis is small when looking at cumulative training loads over years instead of months. One simple way to observe progression is to think about the blue area under the curve. The bigger this area is, the more you are likely to have accumulated more training load. And of course, if you just want to train then consider hiring a coach to do all this for you!

While I believe most athletes want to improve their performers and times, not everyone may be as ambitious as Corey who is prepared to make the year-on-year sacrifices to find his true potential as a runner. But if there is one takeaway I would like you to consider it is that taking time to review your previous years training load is worth doing. Once you have a sense of what training loads you are capable of, set some goals to both increase the training load you can achieve, and also the duration for which you can maintain it. If you look at the charts you can see that Corey is in a cycle coming back from an injury sustained late in 2020. As we work together on more PB’s we can be confident that the steep increase in load in 2021 is realistic as we have done it before. It is an exciting prospect to work with him and see what is possible in 2021.

A circular photograph of endurance sports Coach Mike LennonThis article was written by Coach Mike Lennon, based in Brisbane, Australia. He coaches runners and triathletes online via SportTracks. If you're interested in training with him, visit his SportTracks Coach Profile or send him an email at coachmiketraining@gmail.com
Training
https://cache.sporttracks.mobi/blog/images/2021/02/how-to-use-trainingload-runner-cover.jpg

Bike Terms Defined

$
0
0

Bike Parts Glossary

Cog: 

 One of the rear sprockets that attaches to the hub on the rear wheel.

Cassette:

A group of stacked sprockets on the rear wheel of a bicycle with a rear derailleur.

Chainring:

A large cog carrying the chain on a bicycle, which is attached to the crank.

Crank:

One of  a set of two on a bicycle that converts the reciprocating motion of the rider's legs into rotational motion used to drive the chain or belt, which in turn drives the rear wheel.

Spindle:

An axle around which a pedal rotates; threaded at one end to screw into crank arms.

Derailleur:

An assembly of levers, usually cable actuated, that moves the chain between sprockets on a cassette or chainring assembly.

Gearing:

The aspect of a bicycle drivetrain that determines the relation between the cadence, the rate at which the rider pedals, and the rate at which the drive wheel turns.

Community
https://cache.sporttracks.mobi/blog/images/2021/02/bikeparts-diagram-cover.png

Finding My Gear

$
0
0

The Gearing Dilemma

Like many individuals riding dirt, I’m considering going to a single chainring from the current double.  What we’re going to do is look at the current maximum and minimum gearing ratios on my bike and see if it makes sense to go with a single chain ring. The same calculations can be performed if a person is going considering going from a standard road crankset to a compact, or deciding to upsize the rings on a time trial bike. 

Here’s the thing, I’d prefer to not convert to an 11-speed rear since that requires a new cassette, derailleur, and freehub or wheel and turns out to be pretty pricey to effectively take stuff off the bike. Let’s see how that desire works out.

The Process

Before we run online to look at calculators, crunch numbers, and put credit cards on the glass at the local bike shop, we need to go for a ride. This is a time to be honest with yourself; go for an average ride. When you’re out on the bike, pay attention to what gears you’re using and the cadence or speed you’re riding at—mostly one ring, mostly the low end of the cassette? This becomes very important later. Then after you’ve done that ride—preferably multiple rides to establish a good average—go out for an outlier ride. Something with a ton of hills, or the flat TT course with a slight tail wind. Again pay attention to the gears you’re using and the cadence or speed you ride.

Since I’m going to be the guinea pig again, I’ll let you know the results of my survey. On single track, I find myself in the small ring, middle cassette; on steep hills (15-25 percent) I’m in the small ring, lowest cassette cogs; on fire roads I’m in the big ring, faster half of the cassette. In general, it seems my bike is geared faster than I normally ride—I spend more time in lower gears than higher gears. My baseline configuration is a 26-39T double crankset with a 12-36 cassette, giving the bike a maximum gearing ratio of 3.3 and a minimum gearing ratio of 0.7 and an average cadence of 70. Using this calculator, my example looks like this:

When you click on the thumbnail image, you'll see a pop-up chart of all possible gear ratios given a range of chainringsfrom 26-39 and cog sizes from 12-36, with my specific setup.

So what does that all mean? Let’s look at my low end gear ratio—0.7. What would it take to get something like that with a single chainring setup? Let’s look at a 30-tooth chainring for now; a 30-36 gear gives us a high 0.8. Looking at my current gearing, a high 0.8 is about 26-32. This means if I went to a 30 tooth single chain ring, I’d effectively lose my lowest gear—a gear I only find myself using while spinning above 10 percent and standing above 18 percent. Those instances are pretty rare, times when I might only be going 2-4 mph but I might find myself pushing uphill a little more often when super steep and I’m tired. Looking at this chart, it may seem a little daunting with all the numbers. For convenience, it shows every gear between the specified maximum and minimum. Meaning the only boxes we’re interested in are the furthest right and left columns—the chain ring size—and the rows: 12, 13, 15, 17, 19, 22, 25, 28, 32, and 36 for our cassette cogs.

A photo of mountain biker catching air

So far a 30-tooth seems feasible; let’s look at the top end. In 30-12, my gearing ratio is 2.5; on a 39-tooth ring, that corresponds to somewhere between a 15 and 16-tooth cog on the current setup, meaning I’d lose about two gears on the top end. Usually I find myself using those gears when ferrying the bike on pavement or on downhill segments. These instances are even more infrequent than my low end gears, and arguably less important—how much time would be saved in a race getting the last mile per hour or two out of the top end?

Based on my example, given my current riding habits, I could really work using a 30-tooth chain ring or make life a little easier using a 28-tooth chain ring, effectively sacrificing three gears on the top end. This same process could be used to convince myself whether or not it would be wise to convert my road bike from a compact crankset (50-34T) to a standard crankset (53-39T).

Another fun feature of the gearing calculator I used above: on the left hand tab there is a link called “speed at cadence” where a user can input their gear sizes and a range of cadences to develop a matrix of speeds. My example, using the 30T ring, looks like the following (keep in mind optimal cycling cadence is generally 90 rpm):

Looking at the speeds, compared to what I’m used to seeing on my Garmin, things look good. I rarely drop under 2 mph and am usually too concentrated on not hitting something and crashing to see myself in the 20s. I’m certain that for some time after putting a 30T on, I’ll feel limited on the top and bottom end, but will get used to it. Based on the speeds listed and considering the gears I’d be forgoing, it seems like the 30T is the way to go.

After writing the previous sections, I went out on the mountain bike considering my gearing limitations. I went out, after a hard ride the day before, and rode a route at a pace which would usually have me pretty tired given no gearing restrictions—I considered this my worst case, tired. When I went out, I remembered my restrictions, no lowest gear and the top two were off limits. I was able to go out and burn down a fire road in the mid 20 miles per hour—indicating I was riding well above the 80 RPM from the example—and able to spin up an, admittedly short, 18 percent grade without significant difficulty. 

It appears a 30T single chain ring will work for me. If I find myself needing more range, certainly changing the chain ring to a different size is an option; I could also change out my lowest cassette cog to one of the 42-tooth cogs that are made to go back to my original gear ratio of 0.7.

Summing It Up

The example which was given in this article, while specific to mountain biking, can be adapted to any type of cycling for an individual which is considering a gearing change. The methods and information provided in the example would be the same across mountain biking, road cycling, and time trialing—albeit with different numbers as the inputs. At the end of the day, the sole determining factor is the riding experience. While it’s not always practical to go through many changes in drive trains looking for the sweet spot, an individual may be able to determine a fairly close setup analytically as developed in these articles.

I'm ready. Lets upgrade my kit.

This article was written by Matt Shinavar

Community
https://cache.sporttracks.mobi/blog/images/2021/02/finding-my-gear-mtb-cover.jpg

Bike Gearing 101

$
0
0

They say power is nothing without control.

While I agree with that statement wholeheartedly, sometimes the trouble is effectively utilizing the power.

This article is the first in a discussion on gearing, with an emphasis on choosing the correct gearing for a specific riding application. (See Part 2 here.)

Just like a time trial bike isn’t the most efficient bike for a training ride with a lot of climbing—the cassette and chainrings on a time trial bike would be out of place on a climbing bike—maybe you have the legs that it just doesn’t matter. These articles will provide the information required to choose appropriate gearing for a specific application.

This first article will discuss the physics behind gearing and cassette selection. The second will focus on cranksets: chainrings and crank arms. The last part will discuss gearing for different types of bikes.

          In this post:

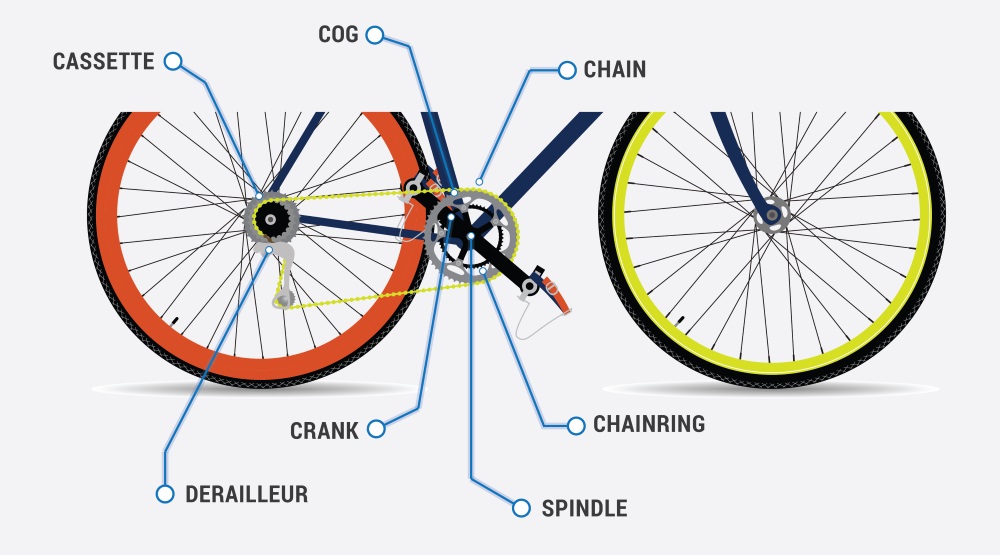
Before we get going, I want to make sure that we're all on the same page in terms of bike anatomy. Follow the link below for our guide (or refresher!) to bike parts and anatomy:

Gearing: Starting with Theory

We all know that using different diameter gears can result in a very high speed or a very low speed for a given pedal speed. Most people generally do not put a lot of thought into why this is the case, probably because knowing which gears go fast and which go slow is enough to make do.

Suppose we have a certain cadence, for convenience we’ll call it ω, the greek letter omega. Omega is the standard nomenclature for a rotational velocity with units of radians per second—measured about our crank spindle. (Radians are like degrees, a measure of angle.)

Since we know the chainrings don’t deform while we pedal—no matter how strong we think we are, they don’t—we can assume that ω is the same at the crank spindle, at the chainring teeth, and at the pedal. The magic happens where the radius at which this ω occurs, and we’ll see what that means in just a bit.

A graphic that explains cycling gear cadence

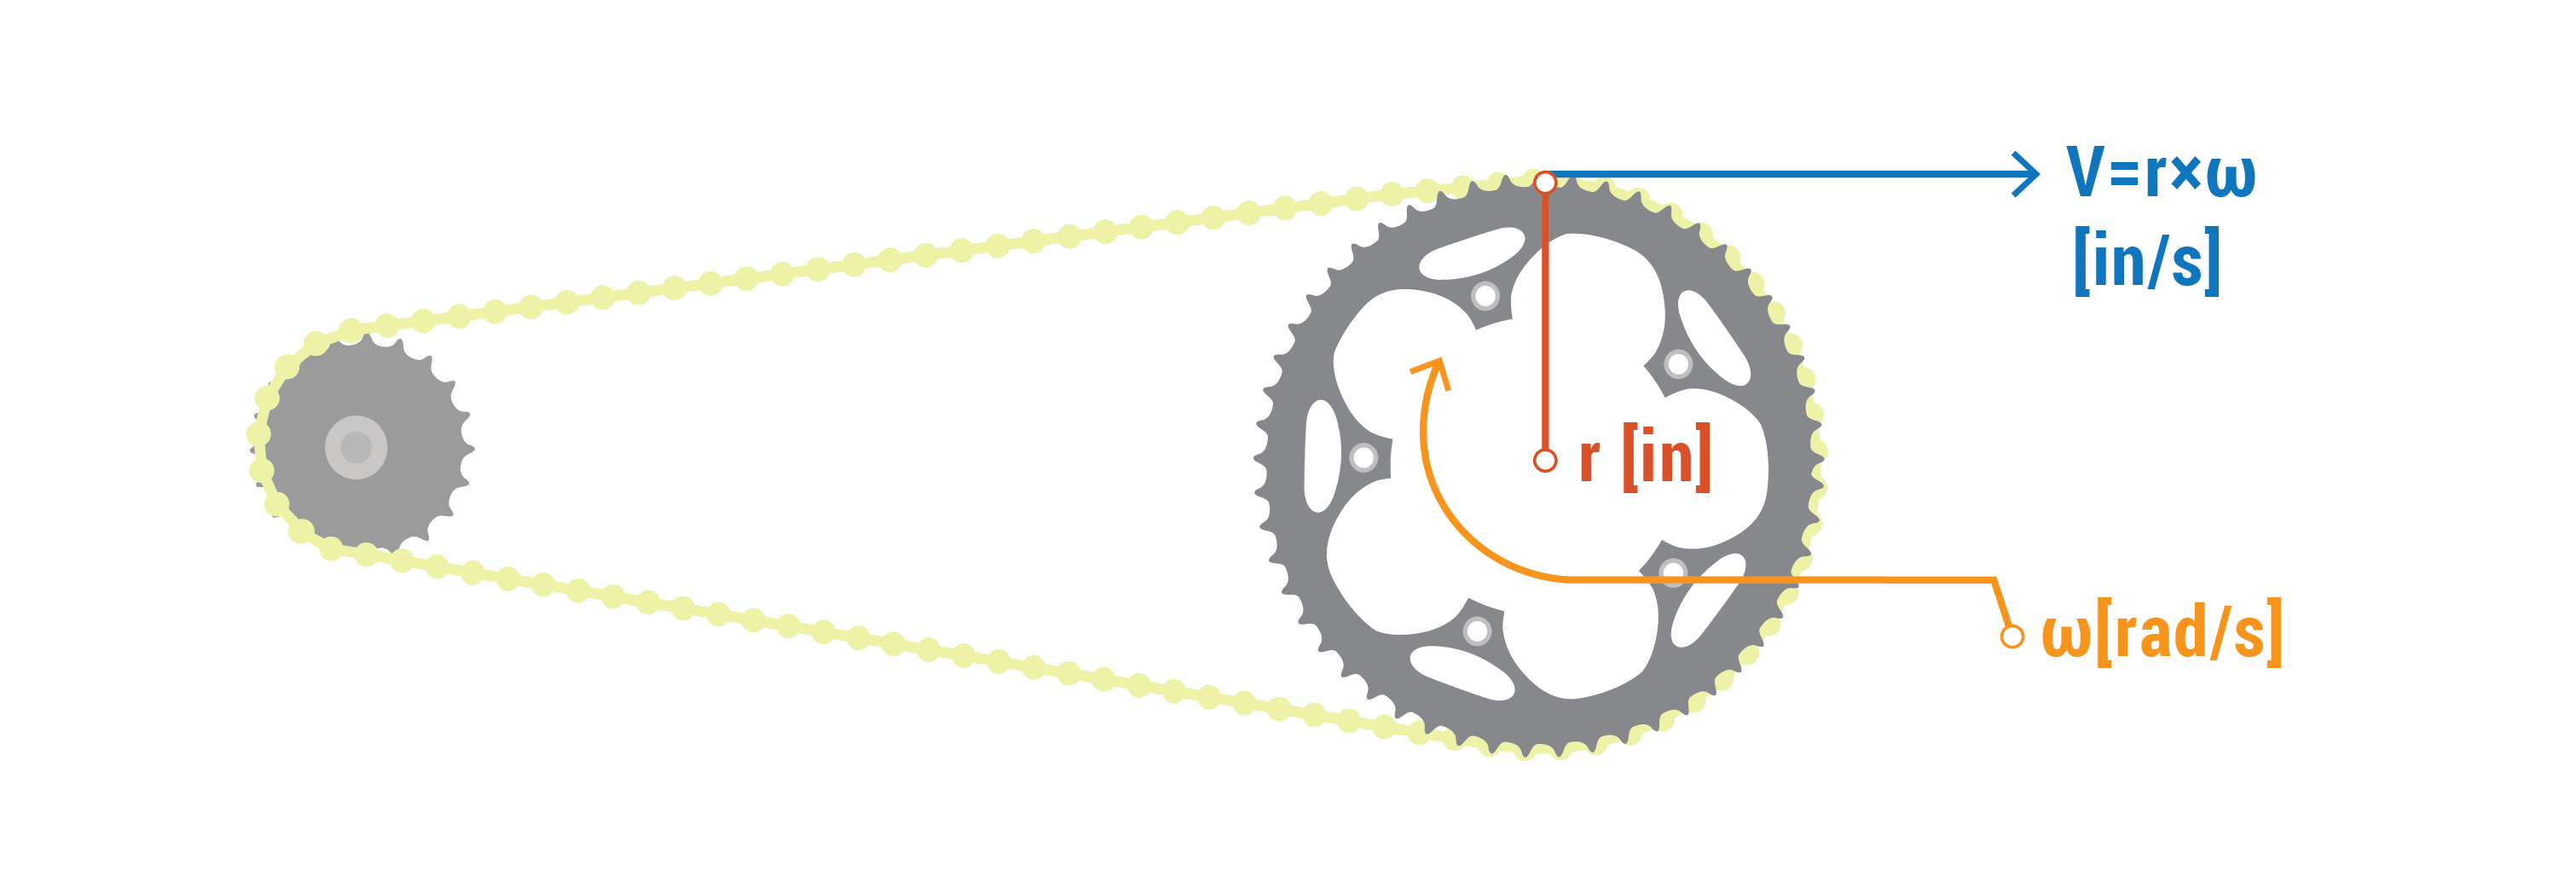
The following image shows the fundamental relationship between angular velocity and tangential velocity.

A graphic diagram of a bicycle chainring

Since we’re a little wild and crazy, assuming the chainrings do not deform while pedaling, let’s also assume the chain does not stretch significantly compared to its length while riding. So we know we’re pedaling at ω and our gear teeth are rotating at ω as well; is our chain also going at ω?

Well, yes and no; mainly no. In the case of the chain, it is more useful to think of its linear velocity V in inches (or meters) per second. So what, as long as the chain connects the chain rings to the cassette, why would we possiblly care about chain speed—I mean, have we ever seen that mentioned online or in magazines before?

Chain speed is absolutely meaningless. Technically speaking, we do need to note that there is a chain speed to develop our gearing relationship, but nobody really cares at all except the cassette. The cassette sees a chain speed come from the chainring, and much like the chain rings, turns that linear velocity into a rotational velocity.

Since we calculate a linear velocity by multiplying the angular velocity and the distance from the axis of rotation, we can calculate the angular velocity of the cassette to be the angular velocity of the chainrings multiplied by the ratio of cassette cog radius to chainring radius.

Cassette angular velocity? Since we don’t measure that with a cadence sensor, is it really that important? Well, we in fact do measure the angular velocity of the cassette, we just find it easier to measure it after it’s been multiplied by the radius of our rear tire—then we call it speed and occasionally measure it with GPS satellites 22,000 miles above the earth.

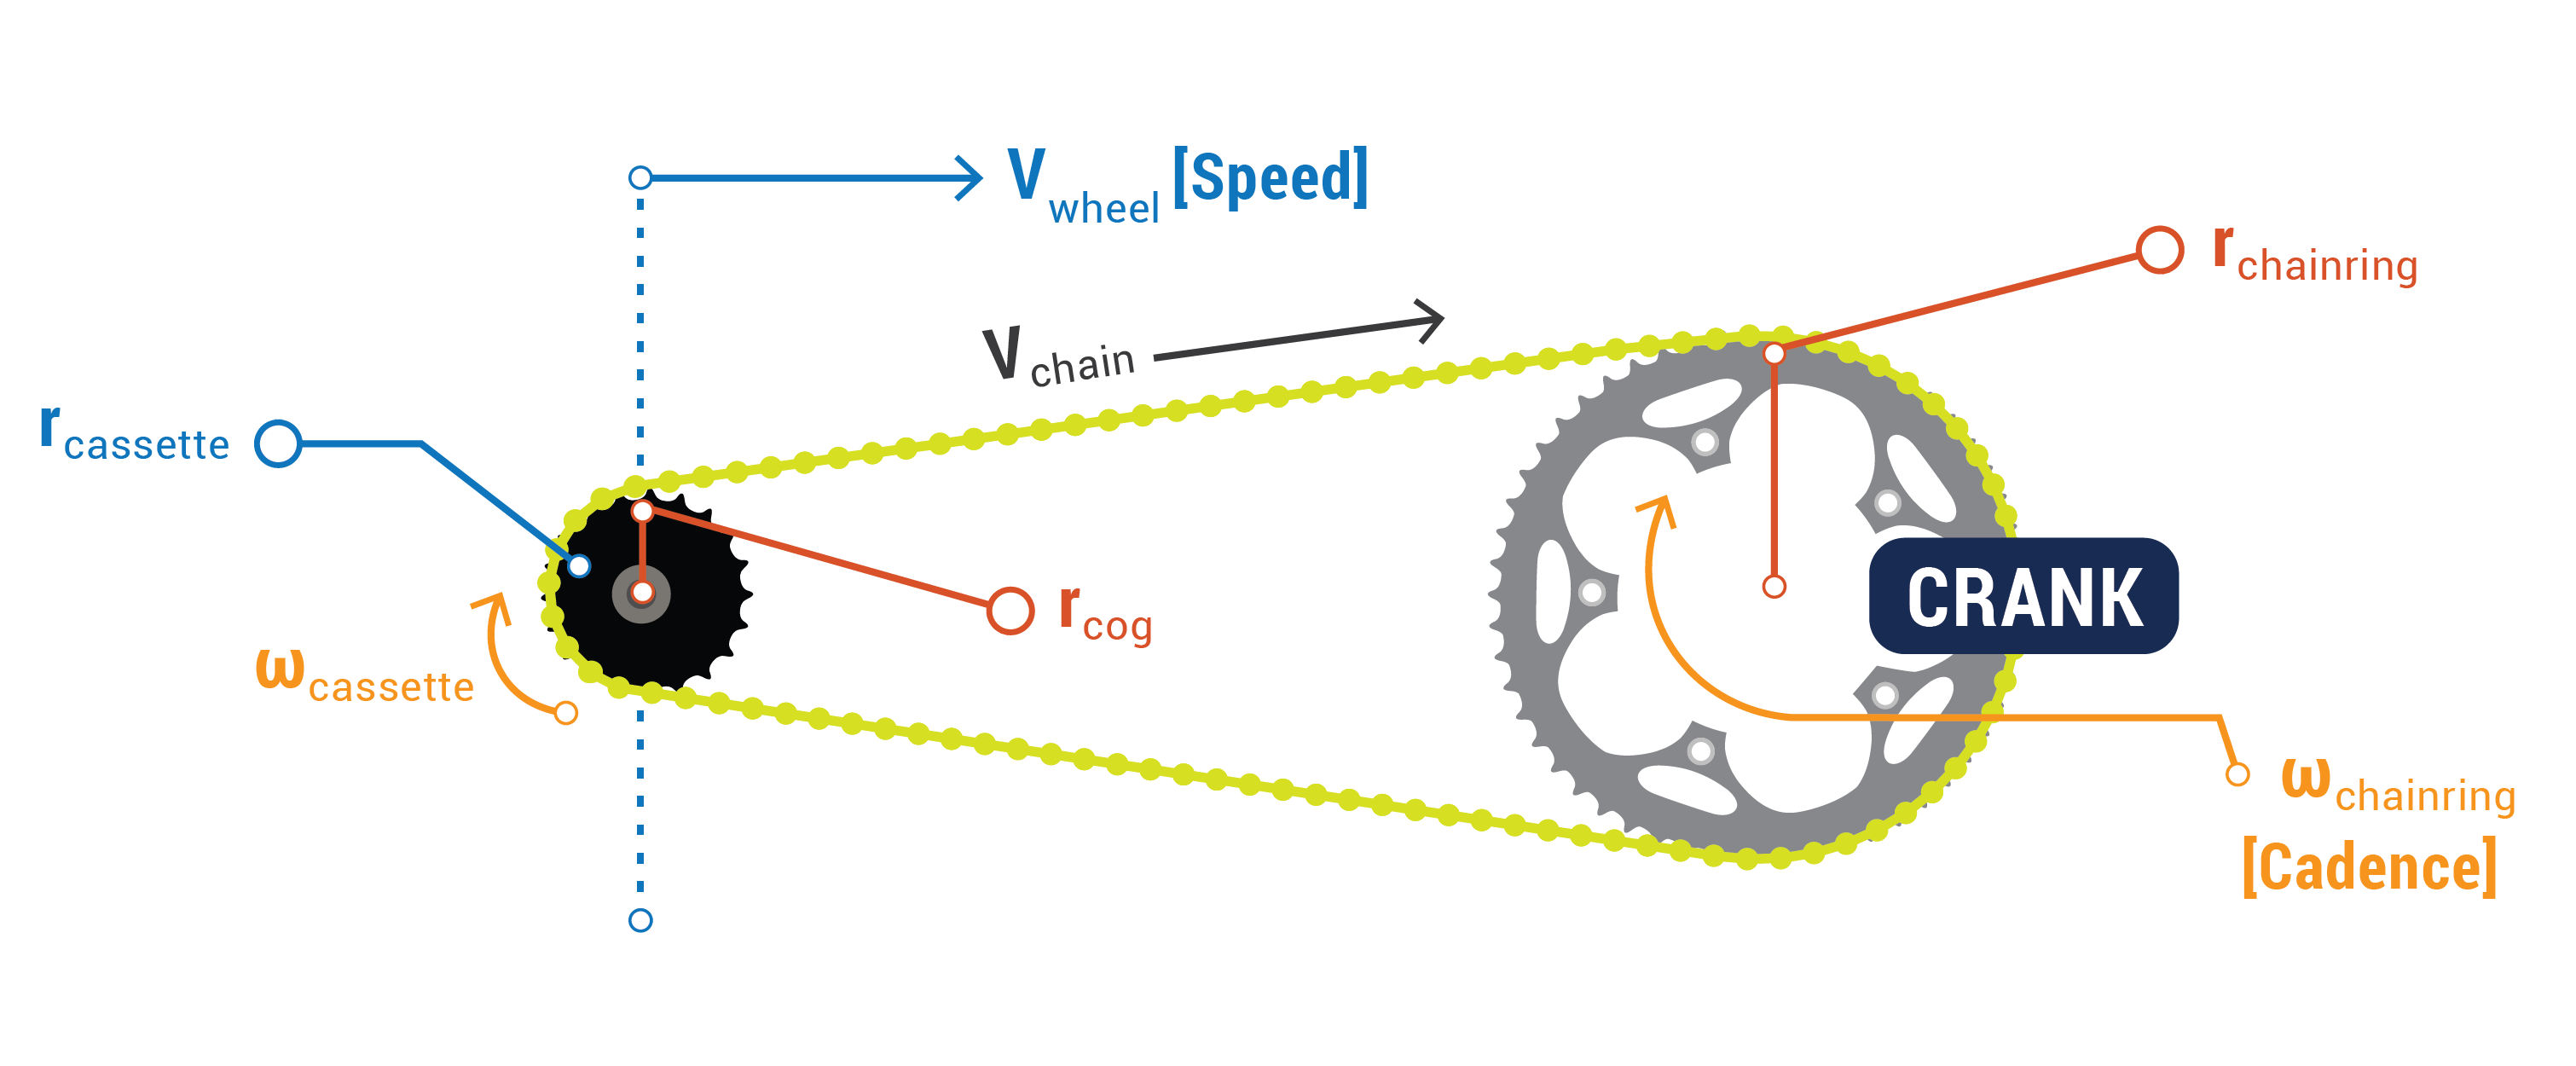
The image below shows everything discussed in the preceding paragraphs—it is messy, but it’s all there; start at the crank and the beginning of the previous paragraph and work towards the wheel speed at the end of this paragraph.

Knowing our desired cadence and gearing ratio, we can determine a speed. Unfortunately, this discussion has been more on the academic side, so a gearing ratio based on the radius of the gears is hardly practical when gears are measured in number of teeth.

We know what the angular tooth spacing of a bicycle gear is, since chains are a standard size, but to calculate along this path much further would only serve to keep us at our desks calculating rather than actually riding.

In general, the gold standard for bicycle information is Sheldon Brown’s website which includes a gearing calculator. I’ve also found the following calculator to be useful—although seemingly daunting at first glance. Luckily, there are many useful gearing calculators online which a user can select gear combinations by number of teeth, input a cadence and wheel size, and find out speed. The online calculators are much more practical, but sometimes an appreciation for the background calculations is a good thought to hang onto while pouring on the power mile after mile.

Putting Theory into Practice

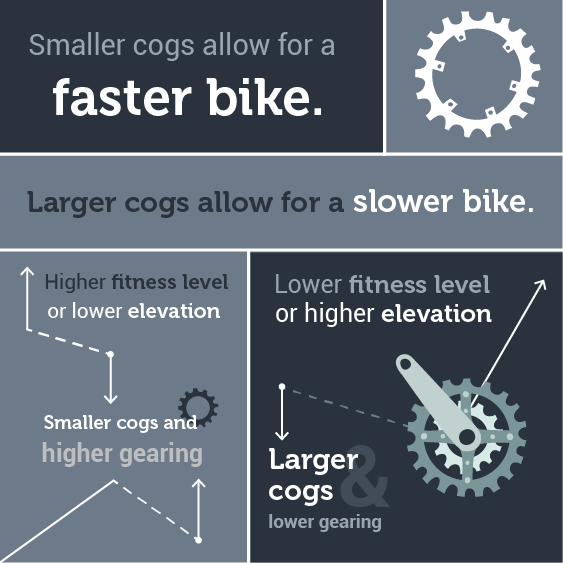
Now onto the practical portion of gearing. As previously mentioned, a cassette should be chosen for a specific riding style and locale—otherwise, we find little enjoyment trying to keep up while fighting our gears. We know that the smaller cogs on a cassette allow the bike to go faster and the larger cogs allow it to go slower—that was intuitively clear after going through the section of the physics behind gears.

How small and how big of a gear do we want? This is where the rider needs to assess their capability and the terrain over which they plan to ride. Typically, a rider with a higher fitness level or someone riding with less elevation gain will gravitate to cassettes that have higher gears, say an 11-23.

Riders with lower fitness or those who plan to put in serious elevation gain tend to gravitate to higher gearing like an 11-32. While anyone could utilize an 11-32, they may find the jumps required to go from 11 to 32 in only 11 gears is annoyingand frequently people will miss their 16T, an apparent sweet spot.

Cassette Sizes Explained

If the nomenclature 11-32, for example, is a mystery, that is a common way cassette sizes are denoted.

For example, Shimano makes an 11-32 cassette with the following teeth: 11, 12, 13, 14, 16, 18, 20, 22, 25, 28, and 32 teeth. We’ll notice making a jump of 21 teeth over eleven cogs leaves some teeth out and at times making the jump of two teeth to the next gear feels inconvenient.

Conversely, Shimano also makes an 11-23 cassette with the following teeth: 11, 12, 13, 14, 15, 16, 17, 18, 19, 21, and 23. There are only two missing gears, a 20 tooth and a 22 toothboth in the lower range which might find the rider out of the saddle, where the body seems to be less sensitive to specific cadence sweet spots.

This is not to say Sram or Campagnolo do not make these cassette sizesall manufacturers make very similarly sized componentsor that Shimano is better or more appropriate than the otherseach have their merits and fan base.

Example Scenarios

Since I’m the only person in the room at the moment to poll, I can tell you that I’m a stronger and bigger rider—tall with powerful legs (meaning I weigh more than average)—so I may find myself using higher gears on even slight declines, and also find myself quickly grabbing lower gears as the grade goes above five percent.

1. The Stronger Rider

My road bike has an 11-27 since my lighter riding partners seem to like hills and my TT bike has an 11-25 because the time trial nearest me insists on having a 500 foot climb in the first four miles, otherwise an 11-23 would find its place in back on the TT bike.

I haven’t been bothered enough by those selections to change cassettes and would probably replace them with equivalents when they’ve worn—some of the people I ride with don’t seem like they would have the leg strength to push an inappropriately large gear due to poor cassette selection.

A photo of a road cyclists outdoors in a race

I don’t mind the larger gear jumps in the 11-27 because leg strength has not historically been a problem; when the cassette jumps two teeth, I can push the weight. This certainly is not a luxury afforded to everyone I ride with.

2. The Lighter Rider

Let’s say you more closely relate with one of my fellow riders who can barely maintain freight train speed on the flats with a headwind, but crushes my hopes and dreams on the climbs. You know the type, 130 pounds soaked with sweat.

This person may find a two-tooth jump in the cogs to be burdensome as the resulting change in cadence may be too taxing on lightweight legs. In this case, the rider may find a smaller cassette to be helpful, say, an 11-32.

If that results in pushing too big a gear, the chainrings can be changed between the standard 53-39T or compact 50-34T rings—there also exists other options based on the riders individual needs. 46-36T is a common cyclocross ring size, and a 55-42T can sometimes be found on strong time trialists’ rigs with many different options between.

In applications besides road cycling, like mountain biking, we find that average speeds are significantly lower. It is standard to have large cassette cog teeth counts in the 30s and even into the 40s.

We also find that wheel size is more variable in the dirt, from 26 to 29 inches. Wheel size also has a slight effect on gearing, specifically, bigger wheels have the effect of higher gearing compared to the same gears on a smaller-wheeled bike. Enough that people occasionally change cassettes or chain rings to suit a change in tire diameter.

On road bikes, this effect is less pronounced with 700mm being the majority and 650mm an alternate option—occasionally we will see women who transition from 650mm to 700mm wheels drop a tooth or two on the chainring to compensate (lowering the bike gearing to balance out the effective higher gearing provided by the wheel size).

Furthermore, in the dirt riders tend to change riding position somewhat frequently—always going from standing to sitting, leaning side to side, moving forward and backward. Constant moving like this tends to lessen the priority on exact gear selection—the wide range in the cassette also helps to ensure there is almost always room to go up or down a gear. My 11-36 cassette seems to work well for cross-country riding at least up to 25 percent grades, although as we’ll see in the next article as I contemplate going to a single chainring I’ll have to closely check my cassette size.

Next up

Next time, we’ll close the loop on bicycle gearing with crankset sizing and finish up the gearing discussion. If it seems confusing right now, it’ll make sense after the next article when we connect the theory with the practical application and discuss the other half of bicycle gearing.

Go to Part 2.

This article was written by Matt Shinavar

Community
https://cache.sporttracks.mobi/blog/images/2021/02/bike-gearing-101-cyclists-cover.jpg
Viewing all 221 articles
Browse latest View live


Latest Images