Quantcast
Channel: SportTracks blogs
Viewing all 221 articles
Browse latest View live

New Tracks in SportTracks

$
0
0

The maps in SportTracks just received a fairly significant upgrade! The next time you visit a workout detail page, be sure to check out these new map features:

  1. Expand to full screen
  2. Color-coded map tracks with workout metrics and intensities

Expand to full screen

Nothing revolutionary here, just a simple button to expand your workout map to fill the entire screen:

Collapsing is as simple as hitting the similar looking  button.

Obviously, this is just a simple utility, but for longer runs and rides it's incredibly useful for gaining a better understanding of the ground you covered. It gets even more useful when you dig into the next feature...

Color-coded map tracks

Did you notice the rainbow-striped line in the image above? Those are the new map tracks that display various workout metrics and intensities. You can change what metric is displayed by selecting the gear icon in the top right corner of the map:

This opens a list of metrics that you can select to overlay on your tracks. On this particular run, I was wearing a heart rate monitor and an Stryd running power meter, so I have many options to chose from.

Once you've selected the metric you want to see, hit the Close button. You'll be brought back to the map with the selected metric on your tracks. The different colors you see represent various intensities. Here's our route intensity key:

As you can see, it works like this:

  1. Blue is the easiest intensity
  2. Green is one step higher than the easiest
  3. Yellow is the middle intensity
  4. Orange is one step higher than the middle
  5. Red as the highest intensity

Our new mapping features works across multiple sports (running, cycling, etc). Any activity that has multiple metrics to review is included.

We hope you like these new features, and that they help you more effectively analyze your workouts! If you have any questions or thoughts, we would love to hear them in the Comments section below...

How To
http://cache.sporttracks.mobi/blog/images/2017/02/new-tracks-sporttracks-map-cover-image.jpg

Rowing Apps + SportTracks

$
0
0

Like runners, cyclists, and triathletes, competitive rowers also utilize fitness tech to maximize their performance both during activities and for post-workout analysis. That's why we're happy to announce that SportTracks now offers multiple rowing data solutions for both stationary machines and on-the-water workouts.

We've partnered with the mobile app PainSled and the Rowsandall website to provide our convenient auto-sync functionality to oar-wielding athletes. When you complete a rowing workout with either of these applications, your data is automatically uploaded to SportTracks.

This is beneficial both for serious rowers and for general users who have access to the popular Concept2 rowing machine. If you go to a gym, it likely has at least one of these machines. Using our partner apps for your rowing sessions will make your workout log, training load, and performance charts all the more detailed and accurate.

Record with PainSled

PainSled is a mobile app that acts as a simple, one-page dashboard for the Concept2 rower, and as a recording device for the workout data. If your Concept2 has the PM5 Performance Monitor, you can connect to PainSled wirelessly because the PM5 supports Bluetooth LE. PainSled also works with PM2, 3, and 4 monitors over USB with the separately available iConnectConcept2 cable.

In addition to providing you with a neatly-organized display of your workout data, PainSled also enables you to easily export TCX, CSV, and JSON files, and of course, auto-sync your workouts directly to SportTracks. PainSled charges an annual $9.99 fee to use the auto-sync feature, but it provides a free month trial so you can test it out. 

The app is available to users of the Apple iPhone and iPod touch, but an Android version is coming soon. In fact, you can sign up to be a beta tester on the PainSled website and likely be up and rowing in a few weeks. 

Go deep with Rowsandall

Think of Rowsandall as being similar to SportTracks, but with all of its analytical tools focused solely on rowing. Like SportTracks, you use third-party mobile apps and devices to record your workout data. Here are the Rowsandall tracking options:

  • PainSled (Apple iOS devices)
  • ErgData and BoatCoach (Android)
  • RowPro and ErgStick (for the Concept2 indoor rower)
  • CrewNerd, Rowing in Motion, and NK SpeedCoach (for on-the-water workouts)

If you want to deeply analyze row-specific data, Rowsandall is an excellent platform to do so. To gain a better understanding of your overall fitness from a variety of sports and activities, SportTracks is the answer. What's nice is that this new integration brings your rowing workouts into SportTracks from a variety of sources.

Row with Power

Just as runners are beginning to use power meters in their training and racing, the same is the case in rowing. The first commercially-available rowing power meter, the NK EmPower Oarlock, hit the market in late 2016.

If you're the type of person who embraces cutting edge sports tech, you'll be happy to know that Rowsandall fully supports power data from the NK EmPower, and that the power data is transferred and fully supported by SportTracks. There are many ways to deeply analyze power data in SportTracks, here are a few:

  • Creating custom charts on the Analysis page
  • Analyzing individual efforts on the workout detail page
  • Listing power stats chronologically on the Workouts page 

Thanks for checking out this post! If you have any thoughts or questions about the use of rowing data in SportTracks, please share them in the Comments section below...

How To
http://cache.sporttracks.mobi/blog/images/2017/03/how-to-use-rowing-apps-photo-graphic-overlay-cover.jpg

HRV4Training comes to Android

$
0
0

In 2016, we announced our partnership with the popular HRV4Training iPhone app, which made it possible to automatically send HRV (heart rate variability) and RHR (resting heart rate) data to the SportTracks Health page. This enabled users to spot trends in their heart rate data, and see how the changes corresponded with their Training Load and Performance charts.

This generated a lot of interest and excitement, but one thing was missing: there wasn't an HRV sync solution for Android users. That changes today. HRV4Training has officially become dual-platform (it's available on both iOS and Android), and the auto-sync functionality with SportTracks is present on both platforms.

What is HRV?

When we talk about HRV, we're not referring to the compact vehicle made by Honda, we're talking about Heart Rate Variability data. This is the measurement of the amount of time between your heart beats. These short increments of time can tell you how your body has recovered from your last workout.

Some GPS watches have the ability to measure HRV, but unfortunately, the implementation of this feature has been lackluster so far. The best way to capture this data is to use a dedicated mobile app, such as HRV4Training. You can quickly learn all of the basics in our How to Train with HRV post.

Optional: additional heart rate monitors

While the insightful recovery advice you get from HRV4Training is excellent, its standout feature is its ability to utilize the built-in camera and flash on your phone to record the data (as opposed to requiring you to strap on a heart rate monitor). That's why we were excited to learn that the built-in camera functionality is also supported in the Android version of HRV4Training!

There are a vast number of Android phones in use, and many different flavors of the Android operating system, too. The HRV4Training team could only test a handful of Android phones in their research, so, they can't guarantee compatibility with all Android phones. However, they did find that phones from past three years were all good enough to be used with HRV4Training. If your phone isn't capable, the app will give you a warning message. If this happens, you can use a separately available Polar H7 chest strap HRM.

Tips for new HRV4Training users

  • Be patient and consistent while gathering data. It takes four days to get your first actionable feedback from the app.
  • You may want to set your alarm clock three minutes earlier to give you enough time to test your HRV before you get out of bed.
  • After the app reads your HRV and you add tags, it suggests a workout intensity for the day. The advice will occasionally end with the words "...go for it!" When you see this, consider pressing harder and try to grab some new PRs.

Thanks for checking out this post! If you have any questions about using HRV4Training with SportTracks, please share them in the Comments section below...

How To
http://cache.sporttracks.mobi/blog/images/2017/03/hrv4training-comes-to-logo-graphics-cover.png

Your new Progress Reports

$
0
0

We’ve just rolled out a new feature that was designed to help you stay on top of your training. Our new Progress Reports are automated emails that display the basic stats from your recent efforts, and list any upcoming workouts you have planned in your SportTracks calendar.

If you completed several workouts, such as a run/bike brick, they will be in the top section of your Progress Report, including any walks or other activities you tracked. Clicking or tapping on a workout name brings you right to the details of that activity. In addition, if you missed a planned workout, it will be listed in the email with a red "Missed workout" label.

Instead of a dull, monochrome list of words and numbers, your Progress Reports are colorful, engaging, and populated with familiar SportTracks icons and its intuitive layout. You'll see key stats, such as time, distance, and pace, in addition to your custom workout names and the goals of your upcoming workouts.

Get them every day or once a week

You can easily adjust your settings to receive Progress Reports once a day or once a week. The daily reports just show the workouts you completed the day before, and what you have planned next in your calendar. The weekly Progress Reports show a detailed list of your completed workouts and the week ahead.

Progress Reports for coaches

We had coaches in mind when we were building this new feature. It seemed like it would be helpful to provide an automated tool for coaches to get a concise overview of their client's progress, without even needing to log into SportTracks.

Coach Progress Reports can be delivered daily or weekly. The daily emails lists all of the same recent and upcoming workout information for every one of their clients. The weekly email offers a consolidated summary, breaking out each sport type with total milage or time.

In either type of email, the coach can click or tap on a client's name to be taken to their SportTracks account.

Not into email?

Got enough email in your life and prefer to opt out? No problem! You can easily turn these emails off in your settings by visiting My Account> Preferences> Notifications> Progress Report.

Thanks for checking out this post! We hope you like the new Progress Reports and they help your training. If you have any questions or comments, please share them below... 

How To
http://cache.sporttracks.mobi/blog/images/2017/03/your-new-progress-email-on-an-iphone-cover.png

Running with a Power Meter

$
0
0

If you want to be as competitive as possible in running  power is a metric you shouldn't ignore. In cycling, power is widely accepted as being critically important, but in running it's a brand-new frontier. But, even in these early days, power meters are proving to be effective tools for runners seeking an edge.

The goal of this article is to clearly explain some of the ways a power meter can help you improve your running performance, without using overly complex language. This subject tends to get extremely technical extremely quickly, but that's not what you'll find here.

The essence of running with a power meter is simple. When you run, your body has to work to propel itself forward. A power meter simply measures how much work you’re doing, and how fast you’re doing it. The basic equation that's used to calculate power in cycling is the same in running: power is equal to force times velocity.

Force is the work your body does to move forward, velocity is the speed at which it happens. 

This may seem somewhat similar to pace, but power is completely different. Pace is a time-based metric that estimates how long it will take you to run a mile or a kilometer. Power is presented in watts, and it gives you an idea how much energy you're using (similar to an electrical meter on a building).

In running, pace is an extremely important tool for both training and racing — but it isn't perfect. A running power meter can fill some of the holes created by the shortcomings of pace. Using the two together makes for a potent combination. 

Power and pace: a complimentary relationship

A well-trained runner knows that if they exceed or drop below a specific pace range for too long, that they will not perform at their full potential. The problem with pace is that it can be skewed by the variables of the environment. Hills, terrain, temperature, and wind all influence pace. If your plan is to maintain a 6:30/mile pace, you will need to work a lot harder to maintain it on a hilly course.

Power is impartial to these variables. When you run uphill with a power meter, you will immediately see your wattage increase. When you know your current threshold power number, you can precisely adjust your running intensity  in the moment  to match the changing demands of your environment.

Pacing uphill without power

The general rule of thumb for running uphill by pace is to use "perceived exertion" as your guide. The idea is that you should have a sense for how hard you've been working to hold your pace, and that you should try to maintain that level of exertion going uphill, even though your pace will be slower.

This is a long-standing method that has helped many runners successfully compete, but the problem is that it relies on the runner's awareness of their inner sensations, not on a quantified workout metric.

Pacing uphill with power

When you run uphill with a power meter, there is no guesswork involved with adjusting your intensity. A quick glance at your watch tells you exactly how hard you're working, and when you know your threshold power, you will know the precise wattage you need to maintain on the hill. You will be moving at a slower pace, but you will be expending a targeted amount of energy. You won't be over or under doing it.

Instead of viewing power as a replacement for other running metrics, think of it as a partner. Power supplies you with a reliable number that tells you exactly what's happening at the moment, regardless of the conditions and your health. It's a new and impressively accurate arrow in your quiver.

Fast and immediate feedback

Heart rate is a useful metric that can help you determine if your fitness is improving or declining, but one of its downsides is how detached it is from the dynamics of your workouts. When you start running it takes heart rate a long time to ramp up, and when you stop it can take just as long to settle down.

Pace is generally a much more responsive metric than heart rate, but it can still lag behind and suffer from inaccuracy — depending on the quality of your current GPS signal and/or the device you're using to monitor it.

Power is an extremely responsive metric that doesn't rely on GPS. For example, the Stryd running power meter not only supplies you with power data, it also measures remarkably accurate distance and pace metrics without GPS. If you're worried about dealing with inaccurate pace data on your GPS watch when running in an area with large buildings or other environments where satellite reception falters, the Styrd footpod is an attractive solution.

While the pacing data from Stryd is excellent, the real draw are the power metrics. You can monitor power in real-time for specific workouts, such as hill repeats, where you can immediately see how hard you're working, and more effectively gauge your performance comparatively. (You can also monitor 3-second, 10-second, and other kinds of averaged power when you use Stryd with Garmin watches that run Connect IQ apps.)

More examples of how running power meters are used

Shaving time off a personal record feels incredibly gratifying, and a running power meter can help make this happen. People often run the same routes over and over again, and if you train with a power meter, routine workouts like these can become valuable experimentation sessions. You can determine if changes in running form and equipment deliver beneficial results. Here are some examples:

Arm swing experimentation

It's no secret that running with a relaxed upper body is advantageous, but determining exactly how much you should swing your arms is a bit more mysterious. When running in identical conditions, intensities, and routes, you can intentionally experiment with your arm swing to see what delivers the fastest speeds using the least amount of wattage.

TIP: Be sure to leave detailed notes about these tests in your training log, such as utilizing the workout notes feature in SportTracks.

Find the most efficient shoe

It's common for runners to own more than one pair of running shoes, but it isn't common for them to identify which of their shoes are the most efficient for a specific terrain and condition. Running a half-marathon on primarily flat, smoothly-paved roads? Don't guess which of your shoes is the most power-efficient for this scenario, determine it.

Figuring out which shoes are best for which terrains and conditions is very similar to how you determine the fastest and most power-efficient arm swing. Test various kinds of shoes on identical routes with as similar conditions as possible, and analyze the data afterward to see which shoes delivered the most efficient runs.

Obviously, power-efficiency isn't the most important factor when deciding what shoes to wear. Fit and feel are still vital factors in shoe selection. But it's still helpful to know how your shoe choices impact your power efficiency on different terrains.

How to get started with running power

When you first start running with power, the numbers won't mean anything. But after you've accumulated data for several weeks and conducted basic, self-run tests to accurately determine your threshold power, things will start to change. Based on feedback from your power meter, and by regularly analyzing your power data, you can begin training to improve.

We strongly advise learning more about the topic if you get a running power meter. This blog post is intentionally focused on the basics; properly utilizing a power meter is more involved. We recommend reading Run with Power by coach Jim Vance (check out our review here). Running power demands a structured and methodical approach, and this book will guide you down the correct path.

It's important to have post-workout analysis software that's specifically geared for running power data. You need to monitor power as you run, but you also need to look at your data afterward to identify trends in your performance. SportTracks features the most built-in running power tools and metrics of any fitness platform, and on top of that, it's easy to use. You can start a 45-day free trial right now, and you won't be charged at the end. 

...if you want new insights that can help you make incremental gains over time, start running with power now.

Final takeaways

This article provides just a small sampling of the benefits of running with power. This data can also be used to help you avoid injuries by overtraining, improve your running form, help you understand when your current training strategy has gone as far as it can go (and quickly gauge the effectiveness of any changes you implement), and much more.    

A running power meter will not immediately make you a faster runner. You will only improve if you regularly analyze your power data, and purposely experiment with your running form, gear, and the intensity and specificity of your training.

The fact that running power meters remove the guesswork from pacing on hills makes them totally worthwhile, but there's so much more they can do. If you want new insights that can help you make incremental gains over time, start running with power now. It's quickly establishing itself as one of the most important metrics in endurance running. 

Training
http://cache.sporttracks.mobi/blog/images/2017/03/why-you-should-run-female-runner-photo-overlay-cover.jpg

Garmin Index Smart Scale support

$
0
0

We're excited to announce that SportTracks is now integrated with the Garmin Index™ Smart Scale! Every time you step on your scale, your current weight and body fat percentage will automatically be sent to SportTracks, and displayed in charts on your Health page.

In addition, your entire history of smart scale measurements will be brought into SportTracks, so you can more effectively analyze your progress season over season. After you enable this integration, the transfer of data takes place automatically in the background, thanks to the Wi-Fi connectivity of the Garmin scale.  

SportTracks collects more fitness data from your Garmin Index Smart Scale in addition to weight and body fat percentage. Keep an eye out for updates in the near future that take full advantage of this new integration!  

How to get it running

New SportTracks users:

This integration will work as soon as you enable auto-sync with Garmin. Your entire smart scale history from Garmin Connect will be imported into SportTracks when you link these accounts.  

Existing SportTracks users:

If you already have SportTracks linked with Garmin Connect, you need to re-authorize this link. This is how to do it:

  1. In the upper right corner of SportTracks, select your profile picture, then press the My account button
  2. On the next page, select the Sharing tab on the left side of the screen
  3. Under Connected Services, locate Garmin Connect, then press the Remove button
  4. Next, press the (+) Connect button, and then select Garmin Connect
  5. Authorize the connection between SportTracks and Garmin Connect (you may need to log in)
  6. You do not need to select the "Import all history" option, leave that box unchecked
  7. You're finished!

Selecting the "Import all history" option is unnecessary because this information will be brought into SportTracks automatically. 

We've offered a similar integration with the Withings Smart Body Analyzer and Wireless Scale for a long time now, and we couldn't be happier to also include Garmin. We sincerely hope this integration is beneficial for you. If you have any questions, we encourage you to post them in the Comments section below...

How To
http://cache.sporttracks.mobi/blog/images/2017/04/sporttracks-is-now-integrated-garmin-index-smart-scale-graphic-cover.png

Swimming with a running watch

$
0
0

The ability to accurately track swims used to require a dedicated swimming watch, or a more advanced (and more expensive) multi-sport watch. Recently, a free Connect IQ app called Pool Swim made it possible to track pool workouts with a Garmin 230, 235, or 630 — all mid-level running watches that lack built-in swim tracking features.

In case you're not familiar, Garmin has an app ecosystem called Connect IQ, which enables you to download specific apps to suit your needs. For example, an app called Workout Builder enables you to wirelessly send custom, structured workouts that you create in your SportTracks calendar to your Garmin watch. If you want to start tracking swimming workouts, Pool Swim is the answer.

A Garmin 230 watch on a swimmer's arm

Like all Connect IQ apps, Pool Swim is available as a free download. You can only use it with the Forerunner 230, 235, and 630 because they have access to Connect IQ (many older Garmin watches don't have access), and they lack native swim tracking capabilities.

Using the app

Pool Swim is impressively versatile. After you launch it, if you hold the Up button on your watch for three seconds, you enter a Settings mode. Here you can adjust the length of the pool, turn on Autolap, and customize the data screens that are displayed when you're working out.

However, this app doesn't have access to all of the features of your watch. For example, it cannot display the Distance and Speed fields. These always remain at 0, even when you analyze your data afterward in Garmin Connect. This is a limitation Garmin imposes on Connect IQ apps. The good news is that if you bring your Pool Swim workouts into SportTracks, this data is displayed and is fully available for analysis.

The workout detail page of a swim in SportTracks

Another interesting feature of Pool Swim is that it utilizes heart rate data, which isn't common in swim tracking. If you use the Garmin 235, the app uses the built-in heart rate monitor on the watch. With the Forerunner 230 and 630, you can use the separately available Scosche Rhythm+, which straps to your arm (as opposed to your chest), and provides ANT+ and Bluetooth connectivity.

Getting the app

Downloading and installing Pool Swim is fairly painless. This is how it's done:

  1. Plug your watch into a computer with its USB cable
  2. Launch the Garmin Express program
  3. Click on the watch in the program
  4. Click the Manage Apps button
  5. Click Get More Apps in the bottom right corner
  6. Type the name Pool Swim into the search field
  7. Click the Download button (you may need to sign into Garmin Connect at this point)
  8. Press the Sync button in Garmin Express, and you're done!

Wrapping up

In a way, apps like Pool Swim are one of the best reasons to use Garmin devices. Even if you aren't an active swimmer when you purchase the watch, you can still track pool workouts later  thanks to the power of the Connect IQ app platform.

Would it be better to use a real swimming watch or a true multi-sport watch that tracked metrics like SWOLF, Stroke Rate, and Efficiency? Absolutely. But using Pool Swim provides you with a detailed record of your workout that's far more useful than swimming with a GPS watch in running mode.

The other day accidentally left my Garmin 230 at home, and didn't realize it until I was walking in the door at the gym. I proceeded to execute the swimming workout dictated by my training plan, and afterward I manually entered the details into SportTracks. This opened my eyes to how data-rich workouts tracked by Pool Swim are, compared with the other options I have at my disposal. If you're training in a pool with one of these watches, this app is a must have.

Training
http://cache.sporttracks.mobi/blog/images/2017/05/how-to-track-swims-garmin-230-on-arm-cover.jpg

Running with Stryd

$
0
0

Heart rate, pace, cadence, V20Max... runners have no shortage of metrics to draw from to improve their training, so why introduce even more data with a running power meter? I started running with Stryd six months ago to find out for myself. Elite athletes and coaches claimed it was effective and possibly even revolutionary, but could it help an average runner like me?

If you're totally new to running power meters (which is understandable  it's a brand new technology), we have a separate introductory article that provides a clear explanation of the benefits. Here's the short version: running power meters allow you to see metrics that were previously invisible. They enable you to accurately target specific intensities when running uphill, they give you new insights on how to improve your form, they allow you to gauge the effectiveness of your training strategy on a macro level, and much more.

The basics

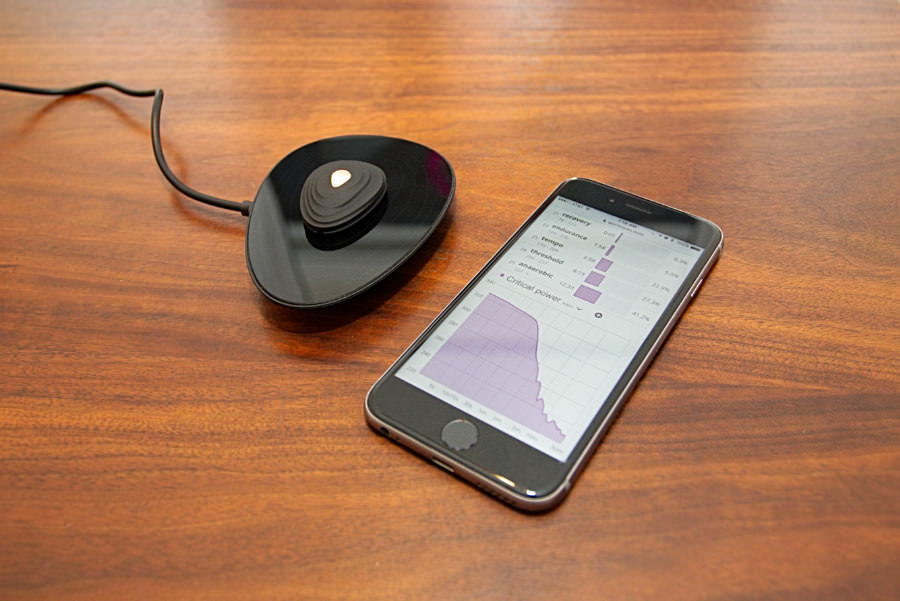
Stryd is a hardware footpod that attaches to the laces of one of your running shoes. It charges on a pad that's included in the box, and a single charge lasts an impressively long time (I often go weeks between charges). It's a rugged yet lightweight device that works perfectly well in rainstorms, snowstorms, heat and humidity, and any other environment runners find themselves in.
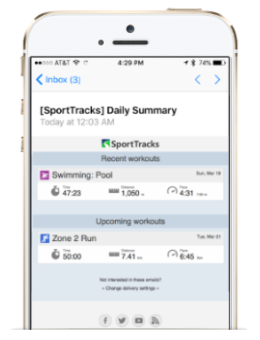
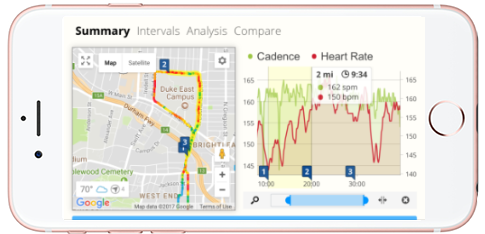
A Stryd running power meter charges beside an iPhone with SportTracks

To get started, you need to create a Stryd account with their free mobile app (available on both iPhone and Android) and input various personal metrics (height, weight, etc.), and then pair the device with your phone via Bluetooth. Unlike a bicycle power meter, no calibration is required to start using Stryd. Once you've set it up, you can start running.

The included shoe clip is impressively strong, especially considering it's a first generation device (an earlier version of Stryd was a chest strap). I've run on all varieties of pavement, gravel, and trails, and my Stryd footpod has not budged. It did fall off once when I decided to mow the lawn immediately after a run (luckily, I found it in the dirt unharmed). I don't recommend wearing Stryd at all times. Just use it for running.

In general, don't fear knocking this device off and losing it. The two included shoe clips are solid, and will hold it firmly in place, even on harsh trails.

Getting moving

It's possible run with Stryd without bringing a phone or a sports watch, but I never tried this. I'm too curious about my data, and unwilling to give up the ability to look at my watts as I run. The first few times I ran with Stryd I used their mobile phone app, just to try it out.

Here's the thing: I never look at metrics on my phone as I run. When I do this, I look at my watch. If I bring my phone, I use it primarily to listen to music or podcasts. As expected, I wasn't interested in continuing to workout with the Stryd app. Holding a phone in my hand while running isn't for me. Thankfully, Stryd offers several watch integrations.

...running power meters allow you to see metrics that were previously invisible.

Garmin has an app ecosystem on their platform called Connect IQ, and Stryd offers both a dedicated app (that you can use instead of the default Run mode) and a Data Screen (which you can use within the default Run mode). For the duration on my review, I used these with my Garmin Forerunner 230. The dedicated app provides an assortment of exclusive power and form metrics, but I found that I preferred using the default Run mode with the Stryd Data Screen, mainly because it allows you to customize the layout.

Stryd can also be used with 14 other Garmin watches, the Suunto Ambit 3 and Spartan, the Polar V800 and the iSmoothRun iPhone app. All of the information you need about using Stryd with these is available in this separate post.

Garmin users: get pace and cadence from Stryd

The Stryd footpod records extremely accurate pace and cadence data. Even though your watch already calculates these metrics from GPS, we strongly recommend adjusting the settings in your watch so that it gathers this data from the Stryd footpod instead.

This is how to set a Garmin 230/235 to receive pace and cadence from Stryd:

  1. Press the Activity button
  2. Select the Run activity
  3. Press the Down button to enter the Run activity’s menu
  4. Press the Down button and select Settings
  5. Select Sensors and Accessories
  6. Press the Down button and select your Stryd footpod
  7. Press the Down button and select Use as Speed Source Always

The Stryd footpod also records extremely accurate distance data, however, most Garmin watches don't let you to set them to receive distance data from Stryd, unless you turn off GPS or use the Indoor Run mode. Athletes who want to train with extremely precise distance data will often turn off GPS in favor of getting distance from Stryd. However, the new Garmin 935 and Fenix 5 give you the option to receive distance data from Stryd without turning off GPS.  

Using running power data

When you first start running with Stryd, it's tempting to want to quickly start training with power. But, as coach Jim Vance advises in his book Run with Power (check out our review in this separate post), it's best to gradually introduce power-based training, rather than jump right in. This is an extremely new fitness metric, so you should adopt a patient, methodical approach.

I used the first couple of months to get a feel for how my pace related to my running power. During runs, I would try to establish a specific pace, then glance at my watch to see how close I came to hitting it. When I saw the number, I would also look at my power to get a feel for how the two related. I did the same on hills, various terrains, and in different kinds of weather conditions.

After I had a few months of power data recorded and I was familiar with my wattage, I conducted a Running FTP test. In case you're not familiar, FTP stands for Functional Threshold Power, which is the maximum effort you can sustain for one hour without slowing down. You use the result of your Running FTP test as a benchmark for your training and races. There are several different ways to do the test, but the two most common are the 30-Minute Time Trial test and Stryd's own 3-9 Minutes test.

Determining and using your Running FTP

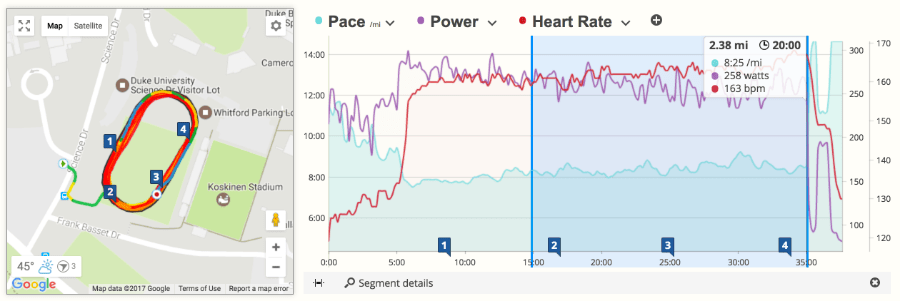
The first test I did with Stryd was the 30-Minute Time Trial test. It appealed to me because it's identical to the test for determining your lactate threshold heart rate, so, if you wear a heart-rate monitor you get a three-for-one: your Running FTP, your LTHR, and your threshold pace.
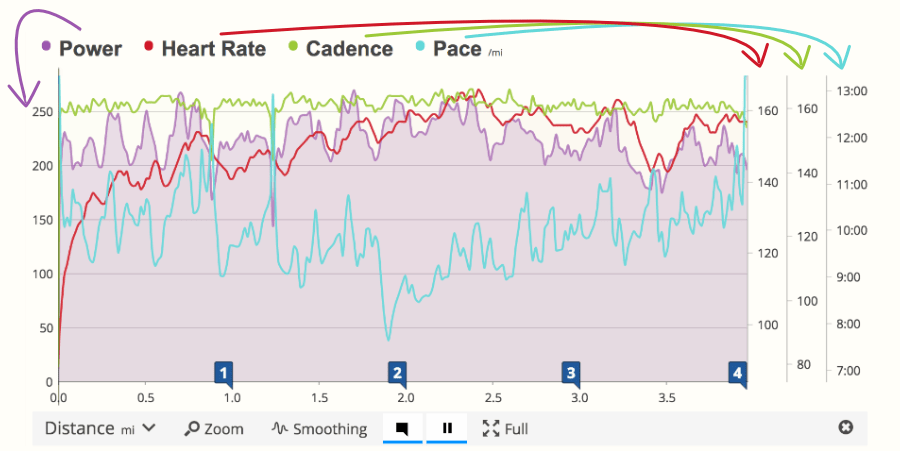
The workout details of a 30-minute LTHR time trial run with a power meter

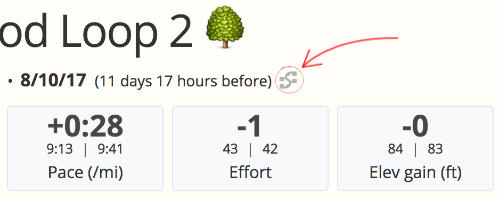
On a flat, uninterrupted course (such as a running track), ideally when it's windless and not too hot or cold, running by yourself (not with a partner or any competitors) you warm up for 15 minutes, then run as fast as possible for 30 minutes while trying to maintain a consistent pace, then cool down. The averages from the final 20 minutes of the 30-minute effort are the results, which you can easily find in SportTracks by clicking and dragging on that portion of the workout. This makes pressing the Lap button on your watch unnecessary during the test.

The drawback of the 30-Minute Time Trial test is that it's physically taxing. It requires a couple days of rest before and afterward, so it can be tricky or impossible to fit into a structured training plan.

It's best to continually test your critical power every six weeks or so. This way your Running FTP is always up to date with your current fitness level. The second time I tested my critical power I used the 3-9 Minutes test that was developed by Stryd, partially because I was curious, and partially because I was in the middle of a training plan for a sprint triathlon.

The 3-9 Minute test only requires you to run hard for 3 minutes, and then 9 minutes after a long walking break. Stryd's test was designed to not disrupt training plans, which is excellent, although afterward I was surprised at how much it wore me out. The results of the 3-9 Minute test also gives your critical pace.

Training with power

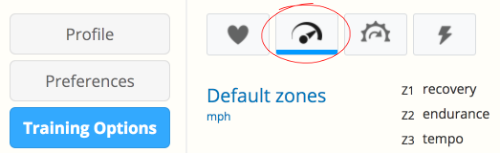
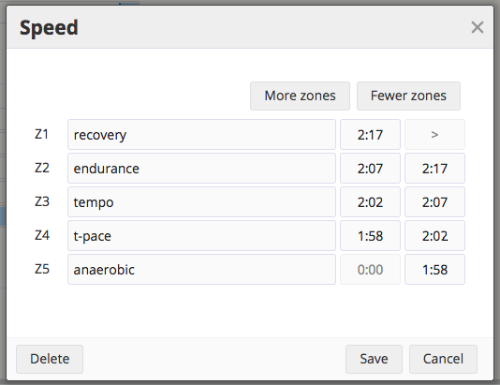
Once you determine your Running FTP, you can assemble power zones based on the result, but it's still too early to start training based on those zones. The Stryd footpod measures your movement in three planes: horizontally, laterally, and vertically. Running power is derived from all three. Your power can go up because your vertical oscillation increased, which is an inefficiency. So in running, it's not a case of MORE POWER = BETTER. It's advised to spend a few months analyzing your running efficiency before you start training with zones, otherwise you could unknowingly train to increase inefficiencies.

There are many efficiency metrics that Stryd captures, such as Ground Contact Time and Vertical Oscillation, however, a more readily actionable metric is your EI, or Efficiency Index. As the name implies, EI tells you how efficiently you ran, and more specifically, how much speed you achieved per watt of output. Higher numbers are better.

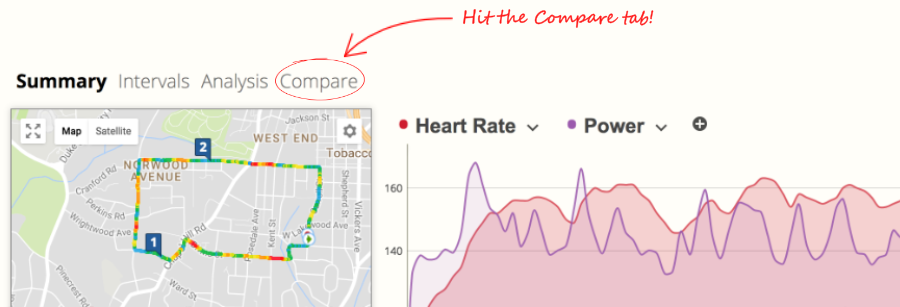
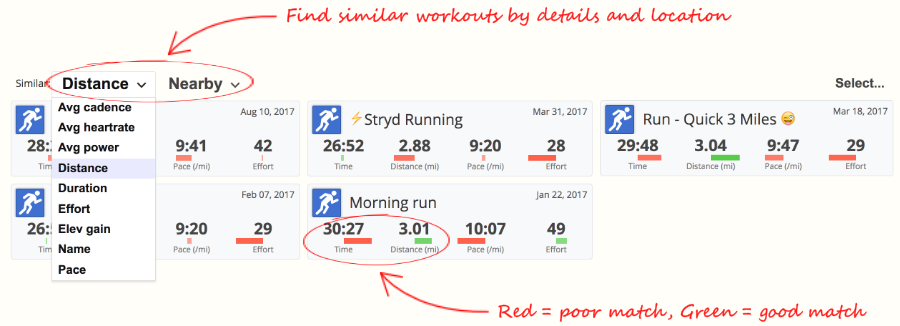
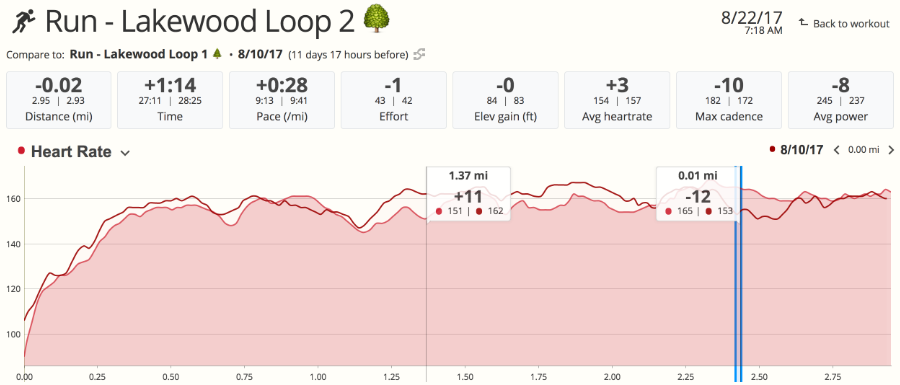
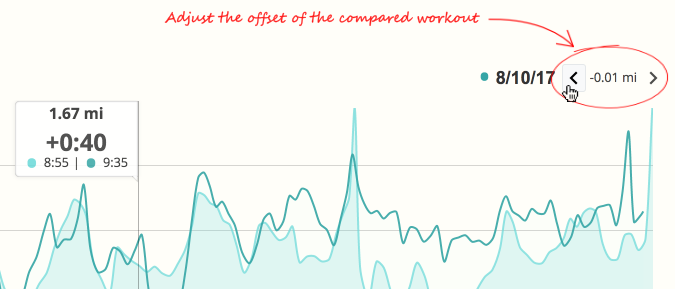
EI is especially useful when you intentionally run at your FTP on identical courses, in similar conditions. This is called EI @ FT (Efficiency Index at Functional Threshold), and when you compare these runs, you can easily see if you're gaining more speed-per-watt — which is one of the key ways Stryd can help you improve. 

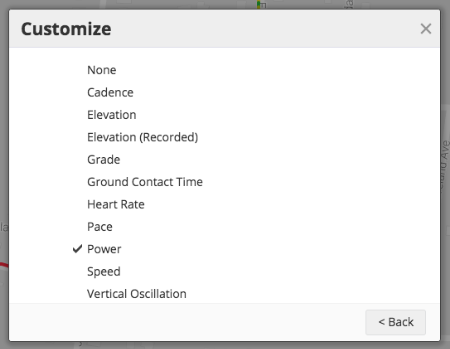
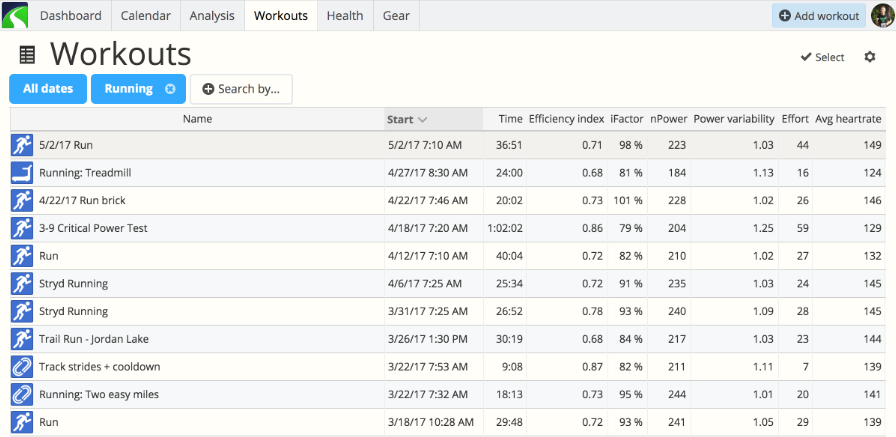
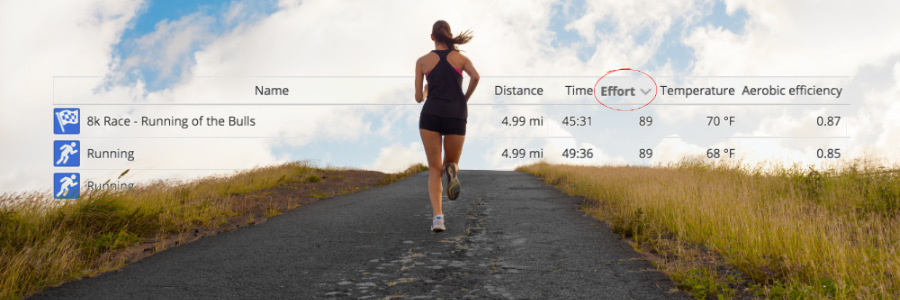
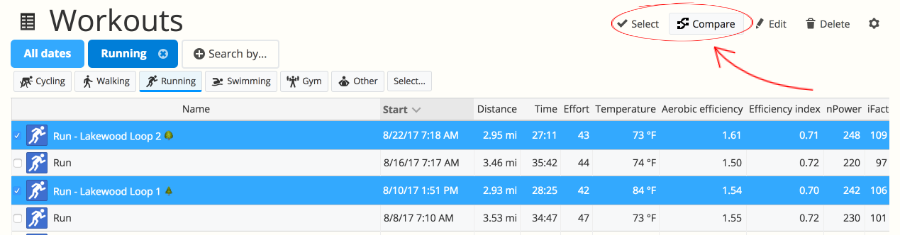
When you run with a power meter, EI is automatically calculated and displayed in SportTracks. Just click twice on the Total Block for pace at the top of any Workout Detail page and you'll see it. EI can also be listed on the SportTracks Workouts page, alongside any other metrics of your choosing, such as nPower and iFactor.

The Workouts page of SportTracks displays several running power metrics

Going deeper into running power data 

Some of the metrics I mentioned in the previous sentence will be familiar if you're an experienced cycling power meter user, but for many runners this is totally new territory. In addition to Running FTP and EI @ FT, there are more running power metrics that are important to understand:

nPower - You're probably accustomed to looking at averages for pace and cadence on runs, so the metric of "average power" probably seems like a natural data point to check. However, when you're running with power, it's more informative to analyze the upper end of your power numbers. nPower gives less weight to the low and middle numbers of your power performance, and more weight to the sections of high intensity, so you get a more accurate idea of the metabolic cost of your run. nPower is automatically calculated in SportTracks. Click once on the Block Total for power at the top of a workout detail page.

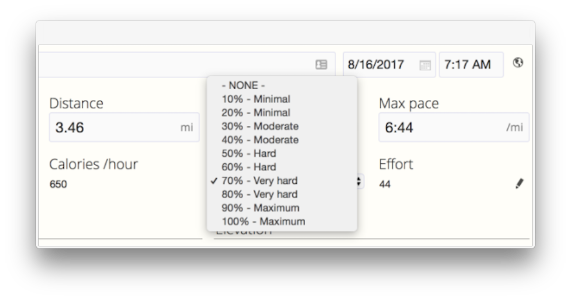
iFactor - After you complete a Running FTP test and add your critical power number to the Power Training Options in SportTracks, a metric called iFactor becomes useful. It tells you the percentage of your Running FTP that you achieved in a workout. Much like glancing at your % of heart rate, iFactor is a quick way to gauge the intensity of a workout. iFactor is displayed in SportTracks by clicking on the Block Total for power four times at the top of a Workout Detail page.

Final thoughts: am I sold?

Some of the better-known experts in endurance sports tech have been timid about fully embracing running power data. By not publishing an in-depth review, DC Rainmaker has played his cards close to the chest, even though he's been using Stryd regularly. Both the 5KRunner and Fellrnr have written about their fondness for the accuracy of Stryd's pace and distance metrics, with only 5KRunner stating that he has converted to pacing his runs with power.

I had an easier time embracing running power. I live near downtown Durham, NC., which is a fairly hilly place. The word "Hill" is in the name of my neighborhood, and in the name of the neighborhood it abuts. When I head out for my runs, I'm going up and down steep hills every time. There is no consistently flat course near my home, unless I zip back and forth on one short block like a madman.

I appreciate pace as a metric, and always pay close attention to it, but I don't find it to be terribly useful for runs near my home. Power, on the other hand, is a more natural fit. It's much more useful for gauging my running intensity in the hilly surroundings of my home.

I still train with pace, heart rate, and the other metrics, but with power I have data that isn’t skewed by environmental conditions, caffeine consumption, the quality of my sleep, etc. Power gives me actionable data that I can use to improve my running form and performance — without guesswork.

Admittedly, six months into using Stryd, I'm still just scratching the surface of what this thing can do. Even though I'm not becoming a threat to the faster runners at local races, I definitely want to continue training with Stryd. Glancing at my power during runs and analyzing the data afterword has become a central part of my running ritual, and by intentionally training to improve my EI @ FT, I see a clear path forward to improvement. 

Even though I wish running power data was a little more straight forward, this feels like the future of the sport, and I'm glad that I'm running with Stryd.

Training
http://cache.sporttracks.mobi/blog/images/2017/05/hands-on-review-stryd-on-charger-cover.jpg

Ground Contact Time

$
0
0

The runners who lead endurance races have more in common than just the ability to maintain fast paces for long periods of time, they also spend less time on the ground and more time in flight. That's why a somewhat obscure metric called ground contact time (GCT) is important to track and analyze; it plays a major role in optimizing your running efficiency and form. 

GCT is the measurement of the amount of time you are in contact with the ground during strides when running, from foot-strike to toe-off. It's closely tied to cadence (the number of steps you take per minute) and vertical oscillation (the height of your vertical bounce). Generally, when you train to improve in one of these areas, it impacts the other two.

A screenshot of SportTracks fitness tracking software showing running dynamics metrics

SportTracks enables you to easily compare GCT with other metrics

Spending less time on the ground and more time in the air helps you increase your speed by reducing the braking effect caused by over striding. When training to improve your ground contact time, you need to keep your vertical oscillation (VO) as low as possible, because excessive bouncing wastes energy moving the weight of your body vertically.

What’s a good ground contact time for running?

Your GCT is a product of your specific physique and abilities. Because this metric is so personal, it only makes sense to compare you to you. It's fine to familiarize yourself with the target numbers, but it's more important to assess your personal capabilities, and whether or not these training practices are giving you more speed.

As a baseline, your GCT should be below 300 milliseconds, however, fast runners often have significantly lower numbers in the 175 - 200 millisecond range. If your GCT is already well under 300, it's still totally worthwhile to train to shorten it, because even a small amount of improvement can make a significant impact on your times in longer races, from 5K's to ultramarathons.

How can I improve my ground contact time?

Training to shorten your ground contact time requires a combination of speed work, strength training, and plyometrics. Increased speed brings higher cadences and more flight time, while strength training and plyometrics will increase leg stiffness, so you reuse the energy from impact for propulsion, instead of absorbing it. Incorporate strides and hill sprints into your weekly training, and concentrate on building strength in your hip flexors and glutes. 

Many of the same training drills that are used to improve speed are used to shorten GCT. The faster you go, the shorter your GCT will typically be. However, if you're not tracking and analyzing this metric, you won't be able to determine what's working and what isn't.

How can I track GCT?

The Stryd running power meter and the Garmin Running Dynamics Pod

Special sensors are required to track GCT and VO. Garmin refers to these metrics as Running Dynamics, and you need specific combinations of their hardware to capture this data. The modules with this capability are the HRM-Run and HRM-Tri, both of which are chest-worn heart rate monitors, and the more recent Running Dynamics Pod, which is a small device that clips to the back of your running shorts.

Here are Garmin's solutions for tracking ground contact time:

 HRM-Run HRM-Tri RD Pod
Forerunner 935oror
Forerunner 920XTor  
Forerunner 735XToror
Forerunner 630    
Forerunner 620    
fēnix 5, 5S, 5Xoror
fēnix Chronosoror
fēnix 3, 3 HRor  
fēnix 2    

Users of the Sunnto Spartan, the Suunto Ambit 3, and the Polar V800 can track these metrics with the Stryd footpod. Stryd provides a variety of running power metrics in addition to GCT and VO, plus it has the most accurate pace and distance tracking available.

Garmin users can use the Stryd footpod as well, which is a nice solution because it brings GCT and VO tracking to the following watches that previously lacked this ability: the Forerunner 230 and 235, 310XT, 910XT, Vivoactive, and Vivoactive HR.

The ability to easily track GCT first arrived in late 2013, when Garmin announced the Forerunner 620 GPS watch and the HRM-Run heart rate monitor. Just a few months later, SportTracks added support for these new metrics (VO was added as well). It was the first major fitness tracking platform to do so, and many other well-known platforms still lack this capability.

It wasn't that long ago that GCT training was something that happened in the dark. Experts had determined that it was an important part of running efficiency, but there were no sensors that could track it. With the advent of new training devices and platforms like SportTracks, you can now target your workouts to optimize your GCT and quickly determine if they're making a difference. 

Training
http://cache.sporttracks.mobi/blog/images/2017/05/what-is-ground-contact-time-runner-photo-st-overlay-cover.jpg

How to use swim zones

$
0
0

Zone-based training isn't exclusively carried out on dry land. There are some basic tests that you can conduct yourself to determine your current swimming pace zones, which you can then use to specify your training. This article explains how to determine your zones, and shows you how to add them to your SportTracks profile so you can properly analyze your swim workout data.

Why swim with zones?

The main benefit of utilizing swim pace zones is to bring training specificity to the water. Zone-based training is widely used in running and cycling, and the benefits they provide apply to swimming as well. Plus, you will be able to analyze your performance over time to determine if you need to make adjustments to your training.

It's not uncommon to encounter coaches and training plans that recommend targeting specific levels of RPE (Rate of Perceived Exertion) in swim workouts. RPE is exactly what it sounds like: you use your feelings to judge how much effort you're exerting.

A swimmer in a lap pool wearing a fitness tracking device

Many people find RPE to be effective for swimming, but, when you establish pace zones that are aligned with your current fitness level, instead of relying entirely on personal perception  you can base your workouts on a quantified metric. Besides, you can always utilize RPE in addition to pace. Using both gives you options you otherwise wouldn't have. The same applies to the tried-and-true pace clock.

What is T-Pace?

The goal of these tests are to determine your current threshold pace, which is often referred to as T-Pace in swimming. Think of T-Pace as the swimming equivalent of an LTHR test in running, or an FTP test in cycling, except, instead of being based on heart rate or power, it's based on swim pace.

Once you determine your current T-Pace, you will base all of your zones on it. For example, Zone 1 will be several seconds slower than your T-Pace, Zone 5 will be several seconds faster than it (this is explained in full later in the article).

How to test your T-Pace

Depending on how advanced of a swimmer you are, there are three different tests you can execute. Please note that the distances are interchangeable between meters and yards.

Each of the three following tests have a 10 minute (or longer) warm up, followed by a 2 minute rest. The main sets should be swum as fast as possible while maintaining a consistent pace. If you record the test with a swimming watch, start a new workout at the beginning of the main section, and pause during rests. If you don't have a watch, note the exact times that you start and stop, or, use a stopwatch.

1000 Meter T-Pace Test

Strong swimmers should take this test. It's the most common T-Pace test, and generally considered the most accurate:

  1. Warm up
  2. Rest for 2 minutes
  3. Swim 1000 meters without resting at a consistent pace
  4. Cool down

The total amount of time that it took you to complete the 1000 meters is central to this test. To determine your T-Pace, take the time it took you to swim 1000 meters, and divide it by 10. The result is your T-Pace. That sounds easy, but you need to adjust the equation to compensate for the mechanics of time (60 seconds = 1 minute, etc.). If you're not in the mood for mathematics, search the web for a time calculator, like this one.

For example, if it took you 19:45 to swim the 1000 meters, your T-Pace would be 1:59.

A screenshot of a T-Pace swimming zones test in SportTracks

3 x 300 Meters T-Pace Test

If you're not strong enough of a swimmer to maintain a consistent race pace for 1000 meters, you should execute this 3 x 300 T-Pace Test instead. Keep the pace each set within 15 seconds of each other:

  1. Warm up
  2. Rest for 2 minutes
  3. Swim 300 meters at a consistent pace
  4. Rest for 30 seconds
  5. Swim a second 300 meters at the same pace
  6. Rest for 30 seconds
  7. Swim a third and final 300 meters at the same pace
  8. Rest and cool down

You calculate your T-Pace by adding together the times from all 3 of the 300 meter efforts (excluding rest periods), and dividing it by 9. For example, if your times were 4:36, 4:41, and 4:47, you would divide 14:04 by 9, resulting in a T-Pace of 1:34.

3 x 100 Meters T-Pace Test

If you're new to swimming (or perhaps a bit rusty), you can determine your T-Pace with this test. Keep the pace each set within 5 seconds of each other: 

  1. Warm up
  2. Rest for 2 minutes
  3. Swim 100 meters at a consistent pace
  4. Rest for 15 seconds
  5. Swim a second 100 meters at the same pace
  6. Rest for 15 seconds
  7. Swim a third and final 100 meters at the same pace
  8. Rest and cool down

Calculate your T-Pace by adding together the time from all 3 of the 100 meter efforts (excluding the rest periods), and divide by 3. For example, if your times were 2:24, 2:27, and 2:31, you would divide 7:22 by 3, resulting in a T-Pace of 2:27.

How to add swimming pace zones to SportTracks

SportTracks features dedicated analysis tools for running, cycling, and swimming as well, and it has a comprehensive and flexible suite of zone settings for each sport. This is how to enable your swimming zones:

  1. In the upper right corner or SportTracks, select your profile, then select My account
  2. In the tabs on the left of the screen, select Training Options
  3. On the next screen, select the Pace button (it's to the right of the Heart Rate button)A screenshot of the training options for pace in SportTracks
  4. Scroll to the bottom and select the Add zones button
  5. In the card that appears, select the Swimming sport type

How to adjust swim zones based on your T-Pace 

When you've completed one of the above tests and determined your current T-Pace, you should adjust your swimming pace zones in SportTracks accordingly. Because zones are ranges, you will be positioning your T-Pace time in the middle of Zone 4.

This is how to adjust your swimming pace zones:

Zone 1T-Pace plus 17 seconds>
Zone 2T-Pace plus 7 secondsT-Pace plus 17 seconds
Zone 3T-Pace plus 2 secondsT-Pace plus 7 seconds
Zone 4T-Pace minus 2 secondsT-Pace plus 2 seconds
Zone 50:00T-Pace minus 2 seconds

For example, if your T-Pace was 2:00, you would adjust your Zone 4 range to be 1:58 to 2:02, a 5-second range with 2:00 in the middle. Then you would adjust Zone 3 to be 2:02 to 2:07, a range 5 seconds slower than Zone 4. Next, you would adjust Zone 2 to be 2:07 to 2:17, a range 10 seconds slower than Zone 3. Zone 1 would be 2:17 to >, and Zone 5 would be 1:58 to 0:00.

A screenshot of the swimming zone pace ranges in SportTracks

Heart rate and water temperature

If you have a heart rate monitor that's capable of underwater operation, it's advisable to wear it to record your swim workouts. This data is useful for determining your level of cardiovascular fitness and how it relates to your pace training. SportTracks offers comprehensive support for the Garmin HRM-Tri, HRM-Swim, and Suunto Ambit underwater heart rate monitoring solutions. 

Indoor lap pools offer neutral environments where the conditions rarely change, which is great for testing. However, if you swim outdoors or in open water, it may be advantageous to keep a log of the water temperature in your workout notes, as it can influence performance. Utilize the Notes feature in SportTracks, and in the future when you're comparing workouts, you'll be able to consider the temperature of the water in your analysis.

Wrapping up...

There's a lot to like about swim training: the cool, refreshing feel of the water, the impact-free nature of the sport, the ever-present challenge of maintaining optimum form, etc. Adding quantified swim zone training to your routine adds structure, purpose, and focus to this healthy activity.

Training
http://cache.sporttracks.mobi/blog/images/2017/06/how-to-use-swim-zones-swimmer-photo-overlay-cover.jpg

Strength Training for Endurance Athletes

$
0
0

While it's possible for long-distance runners, cyclists, swimmers, and triathletes to train exclusively in their sport, it shouldn't be overlooked that your performance can benefit greatly from also including consistent strength training. Read on to learn how simple drills can propel you to new personal records...

Strength training may not be universally embraced by all endurance athletes, but countless people have reaped the benefits, particularly in the off-season when you have more time to target and build upon specific strengths (as opposed to just racking up lots of miles).

Keep your easy days easy, and dedicate your rest days to resting.

If you're new to this, it's best to start by building up your core strength with basic exercises. Right from the start you should add 30-minutes of this training twice a week, preferably on days that are dedicated to cross-training, or close to a harder endurance workout. Keep your easy days easy, and dedicate your rest days to resting.

What exercises should you do during your biweekly 30-minute routines? Some of the most popular endurance-athlete focused drills are explained below. You should start with body-only, core-strengthening exercises like planks and plyometrics (both are explained below), in addition to push ups, squats, lunges, and if a rowing machine is available — hop on it.

These workouts count. Track them.

Just because you're not running, cycling, or swimming doesn't mean you shouldn't track your strength training workouts. A 30-minute session will impact your overall fitness, and in order for the Training Load section of your SportTracks Health page to be accurate, you should be recording and logging these workouts.

A screenshot of the types of gym workouts in SportTracks

Even if you just enter in a manual workout, SportTracks features a large variety of activity types that you can easily apply. You can enter in the amount of time that you worked out, and the intensity. If you have a sports watch and a heart rate monitor, consider using them to track these workouts. The more data you record, the more accurate your charts will be. 

Get your plank on

A man doing the plank exercise on the beach

When we talk about planking, we're not referring to the silly internet fad from 2010. There are many variations of this static, board-like exercise, but a solid way to start out is with the basic plank that's pictured above:

  • Get on the ground and support your weight on your elbows and toes
  • Keep your shoulders lined up above your elbows
  • Feet spread slightly apart
  • Keep your back straight, and head in line with your back
  • Keep your abdominal and glute muscles tight
  • Hold for 45 seconds to a minute, and repeat 4 to 5 times

Plank variations

A woman does a plank exercise in an indoor gym

Instead of resting on your elbows, go up on your hands, like the upward position of a push up. This is a standard plank, and it's slightly more intense. Keep your hands under your shoulders, and your back straight. Again, hold for 45 seconds to a minute, and repeat 4 to 5 times.

A woman performs a side plank exercise

A side plank will work the sides of your core, adding to your overall strength. Support your body with one arm, while keeping your feet beside one another (like in the photo above). Raising your opposing arm is optional, as it makes this exercise more intense. Repeat on both sides to work both sides of your core.

Plyometrics: Fancy talk for jumping

A person doing plyometrics wearing Converse low-top sneakers

Plyometrics are short, high-energy exercises that have you bounding up and down. There are lots of variations, from simply jumping rope to hopping up to boxes at knee-level height on one foot. These exercises are used by sprinters and high jumpers, but for endurance athletes they can improve your speed, power, and flexibility. They're also very helpful for improving your running form and reducing your ground contact time.

Even though this exercise has explosive movements, the goal isn't to thrash around aggressively. It's quite the opposite. You should focus on making soft landings and maintaining smooth transfers of your weight and body position. 

Instead of going from nothing to repetitively hopping onto a 24-inch box, gradually ease your way in. For starters, if there's a jump rope lying around, pick it up and have a go. It's more likely difficult than you realize. Try alternating feet, and jumping with both feet from side to side.

Squat Jumps

Before you start jumping onto boxes, condition your body to the motions with squat jumps:

  1. Standing with your feet at shoulder distance apart, lower into a squat
  2. Stick your posterior out and keep your knees behind your toes
  3. Push off with your toes and jump straight up
  4. Straighten your legs in the air
  5. Land as softly as you can, drop right back into the squat position and repeat
  6. Do 3 sets with 8 to 10 repetitions each

Box Jumps

When you're ready to step up to box jumps, start with a low 6-inch (15 cm) pylo box, and gradually work up to using taller boxes as you grow more confident:

  1. Standing in front of the box, bend your knees
  2. Jump with both feet, and swing your arms to guide yourself
  3. Land on top of the box as lightly and quietly as possible 
  4. Carefully step down again (don't jump down), and repeat
  5. Do 3 sets with 8 to 10 repetitions each

Wrapping up

The exercises covered in this post just scratch the surface of strength training for endurance sports. There are many benefits endurance athletes can gain by incorporating specific weight training exercises, and by utilizing additional core-strengthening drills. But, the moves covered in this post can serve as a base to make you stronger today and well into the future.

Training
http://cache.sporttracks.mobi/blog/images/2017/06/strength-training-female-at-gym-photo-cover.jpg

Using the Workout Detail chart

$
0
0

We work hard to make SportTracks easy to use, while still being the most powerful training platform on the planet  in addition to that, we also put a lot of effort into helping you understand how to use it. In this post, we'll take a close look at the chart on the Workout Detail page.

If you use SportTracks, you likely already use this chart quite a bit, as it's the central focus of the Workout Detail page. This post will go over its most important functions, so you can be sure you're using it to its fullest potential. And please note, in order to get this chart, your workouts need recorded data (it doesn't appear on manually entered workouts). 

Metric Stacking

One of the most basic capabilities of the Workout Detail chart is to stack multiple metrics. This enables you to easily see how the various factors of your fitness relate to one another. We think it's an essential tool for performance analysis, yet, competing platforms either don't have it, or feature a clunky, less informative implementation of it.

In order to keep this chart from becoming too busy and difficult to read, you can stack up to four metrics at once. The first metric you select has a corresponding vertical scale on the far left side of the chart. As you stack more metrics to the right, their corresponding scales will stack on the far right side of the chart, in the same order:

The Workout Detail chart in SportTracks fitness tracking software

TIPS: 

  • The top end of the chart doesn't always equal increased intensity. For example, Pace increases as it moves downward.
  • Power is shaded-in because it's the first metric on the chart. When you only have two metrics on the chart, both will be shaded-in.
  • Try overlaying your heart rate with your speed to see how they relate. Determine if there is a point that your heart rate increases and stays high. As you get more fit, see if this behaviour changes.
  • Other interesting combinations to stack are speed and elevation/grade, and in running try stacking cadence with vertical oscillation and ground contact time. 

Let's turn our attention to the toolbar at the base. We'll take a deeper look at the Time and Distance tool in a moment, but let's run through the other items first:

  • Zoom: Like the name implies, this gives you a closer view of the data on the chart, so you can dissect the fine details of your efforts.
  • Smoothing: This reduces the jaggedness of the data in order to show broader patterns. You can add lots of smoothing or turn it off completely simply by adjusting its slider.
  • Interval Marker: These are points in the chart that show Laps (set by your GPS device), Hills, or Miles/Kilometers. When you change the type of interval in the toolbar, the map will update to display the same markers. 
  • Pause: If you use the auto-pause feature on a GPS device, or if you press Stop during a workout, the pauses will be displayed on the chart when you press this button. 
  • Full: This is the last icon on the right. It simply expands the chart to the full width of your browser, just like the tool in the SportTracks maps

Time and Distance

The first option on the left is a drop-down menu that enables you to easily change the x-axis (or horizontal plane) of the chart to either Time or Distance. If you recorded a pool swim using a watch with a dedicated swim mode, you will have the option of Time or Length.

Why switch between Time and Distance? Runners typically prefer to use Distance, as it makes it easy to analyze runs based on miles or kilometers. However, it's critical to be able to switch a run workout to Time when analyzing the results of a Lactate Threshold test or time-based intervals.

Switching between Time and Distance changes how all of the data on the chart is displayed, including the scales on the sides. For example, on a run with timed intervals, if you change the chart to display Distance, the intervals will be different sizes (if you varied your speed). If you change this workout to Time, the intervals would be a uniform size (if you executed intervals with equal durations).

Interacting with the chart

When you hover your cursor over the chart, or when you tap on the chart using a mobile device, SportTracks displays a Hover Tip for the selected point in the workout. A Hover Tip is a little graphical box that displays the metrics for that moment in the workout; it's a snapshot of the metrics you've selected to analyze (pace, cadence, heart rate, etc.).

The SportTracks Workout Detail page on an iPhone

When using a mobile device, if you tap an Interval Marker, the selected interval will be highlighted on the chart and on the map, and the metrics for that interval will be displayed in a graphical box. This also works on desktop and laptop computers by clicking the interval marker.

When you're using SportTracks on a computer, try clicking an Interval Marker, and then hover your cursor over another Interval Marker. When you do this, the interval that you clicked will have a Hover Tip, and the interval that you're mousing over will have a Hover Tip as well. It can interesting to do this with an interval from an early part of a workout and an interval from a later part of a workout, to see if your pace faded, or your heart rate increased, etc.

If you click and drag your cursor on the chart when using a desktop or laptop computer, SportTracks displays the metrics for the selected segment, and highlights this section of the workout on the map as well. Doing this also makes the powerful Segment details button appear below. Clicking this button takes you to another screen that you can learn more about in this blog post.

Wrapping up

The more sensors you use to track workouts, the more data you'll have to stack and compare on the Workout Detail chart. Besides wearing a heart rate monitor when you run, you can also add sensors to track vertical oscillation, ground contact time, and running power. Some swim watches can track strokes, stroke rate, stroke distance, efficiency, and SWOLF, all of which you can stack on this chart.

Do you use these tools in a way that wasn't covered in this blog post? If so, we would love to hear how you use it in the comments section below! Likewise, if you have any questions about this chart, post it in the comments section and we'll reply to it as soon as we can. Thanks!

How To
http://cache.sporttracks.mobi/blog/images/2017/06/using-workout-detail-iphone-cover.png

What is Aerobic Decoupling?

$
0
0

The squiggly lines and stacks of numbers on Workout Detail charts can be intimidating for people who are new to technical sports training, but luckily one of the most important things they can show you is somewhat easy to identify — even for beginners. What we're looking for is “aerobic decoupling”, and this article explains how to find it, and why it’s important in endurance training and racing.

What is aerobic decoupling, and why should you care?

Aerobic decoupling is when your heart rate drifts away from the power or pace you’ve been maintaining in a workout. When your heart rate is running parallel to these metrics, they are coupled. If your heart rate drifts, they become decoupled. The point at which your heart rate decouples (if it does at all) can tell you if your body is ready to advance to the next stage of training.

Being able to identify heart-rate decoupling is a very effective way to gauge your current aerobic ability. Having strong aerobic endurance is essential if you want to perform your best in longer distance races and events, that's why developing your aerobic fitness is the key to successful base training.

A screenshot of SportTracks fitness software highlighting aerobic decoupling

If you're doing a workout where the goal is to maintain a specific pace or power range, decoupling occurs when your heart rate suddenly increases. Decoupling can also appear when you're doing a workout where the goal is to maintain a specific heart rate zone. In this case, your pace or power will likely decrease as you maintain the steady heart rate.

How to identify aerobic decoupling

In order to utilize this powerful analysis process, you need to wear a heart rate monitor when you work out. The popularity of newer forms of fitness sensors occasionally leads to the assumption that heart-rate data is unnecessary. This couldn’t be further from the truth. While heart-rate data is susceptible to being directly influenced by weather, diet, and recovery — it’s invaluable for determining one of the most critical factors in endurance sports: your aerobic fitness.

The most effective way to gauge your aerobic ability is to intentionally train at specific thresholds for longer durations of time. Casual runs or rides at varying speeds and intensities are not the kinds of workouts you want to analyze. To test your aerobic fitness, you need to target an intensity range and maintain it.

Step 1) Determine your current training thresholds

To determine what intensities to target, you must first establish your current thresholds:

  • Cycling - You need to conduct a test to determine your current Cycling FTP (a power meter is required).
  • Running - Aerobic fitness can be measured with pace or power. To use pace, you need to determine your current Threshold Pace. To use a running power meter, you need to determine your current Functional Threshold Power. You can determine both by executing a single FTP test.

Step 2) Intentionally train at targeted thresholds

  • Cycling - Execute training rides at a range of 65% to 75% of your FTP* in order to test your efficiency. 
  • Running - If you're using pace, train at a range of 75% to 85% of your Threshold Pace*. If you're using power, train at 65% to 75% of your FTP*.

* = More experienced and fit cyclists and runners should target the upper end of these ranges.

Everyone who does these workouts should have a 20-minute low-intensity warmup period in the beginning, with a few 60-second sprints mixed in. A 10-minute (or longer) cooldown without sprints at the end is also recommended.

Duration: Determining the ideal length of these workouts will vary, depending on how long of a distance you are training for. If the target distance is half-marathon or around 56 miles (90 km) in cycling, your aerobic endurance workouts should be around 60 to 90 minutes in length. For marathons and longer-distance cycling events, this workout should be around 120 minutes. For ultra-distance events, these workouts should be around 3 hours long.

This kind of aerobic analysis is extremely important in long-distances, however, it's not a factor in shorter distances (5k, 10k, etc.). 

...power has the advantage of being easier to monitor during the workout itself, especially when running uphill.

Pace vs. Power: Pace has traditionally been used to measure aerobic endurance in running, while power is a relatively new arrival. Both methods provide accurate and actionable results, but power has the advantage of being easier to monitor during the workout itself, especially when running uphill.

Step 3) Analyze the results

As in the screenshot earlier in this article, you want to look at your Workout Detail chart and see if there is a point that your heart rate stops running parallel to your pace and/or power, and decouples. Sometimes this requires using the magnification tool at the base of the chart.

Only analyze the portion of the workout where you maintained your aerobic threshold. Decoupling is always present in the warmup and cooldown segments of a workout, and they are not a concern for this type of analysis.

If your power or pace stay coupled with your heart rate for an entire workout, it's a strong indicator that you're ready to build on your aerobic fitness with the stimulus of specified training (less distance and more speedwork, etc.). If decoupling occurs, you need to do more base training. In running, this typically consists of easy runs, fartleks, sub-threshold tempo runs, and long runs.

Inadequate aerobic fitness isn't the only factor that can trigger decoupling. It can also be caused by dehydration and improper fueling, altitude, weather, and muscle fatigue. When analyzing data, you need to consider all of these elements.

Beyond the chart: Using the Aerobic Efficiency metric

While heart-rate decoupling analysis is an effective way to track your performance, SportTracks provides another way to measure your aerobic fitness. In workouts that have heart-rate data, you get an additional metric called Aerobic Efficiency.

A screenshot of SportTracks fitness software highlighting the Aerobic Efficiency metric

We have a dedicated blog post that fully explains our Aerobic Efficiency metric, but the basic concept is that it's a number that rates your efficiency. The higher the number is, the more efficient you are. If you click on the Total Block for heart rate in a Workout Detail page, you will see your Aerobic Efficiency score.

You can also view your Aerobic Efficiency scores in a list on your SportTracks Workouts page. You can filter this page by sport, and list the temperature of each workout for context. Viewing your AE scores as a list makes it easy to see how your performance trended over time, and how changes in your training potentially influenced your overall efficiency.

In closing...

The ability to track your aerobic fitness is a perfect example of how technology can enhance your training. Workout charts may look confusing at first, but with just a little bit of basic understanding — they become powerful performance improvement tools, even in the hands of a beginner.

Training
http://cache.sporttracks.mobi/blog/images/2017/08/what-is-aerobic-decoupling-st-workout-detail-screenshot-cover.png

Integrating with Polar

$
0
0

We're excited to announce that you can now set your workouts to automatically upload to SportTracks from Polar sports watches and bike computers! If you've ever been tempted to try one of Polar's excellent devices, like the Styrd-compatible V800 multi-sport watch  this seamless integration with SportTracks just might be the incentive you needed. Auto-sync with SportTracks works with all devices that are compatible with Polar Flow.

We've built many innovations into SportTracks over the past decade, and every day we work on exciting new features, but one of the things that makes this partnership special is being a part of Polar's long history of pushing the boundaries of sports tech. They are the company that released the world's first wireless, wearable heart-rate monitor way back in 1982, and it was built specifically for sports training. 

A photograph of the three different colors of the Polar M430 sports watch

How to set up auto-sync

1. Click on your profile in the upper right corner of SportTracks, and the click the My Account button.

2. On the next screen, select the Sharing tab on the left of the screen and then select the Sharing tab on the left, then select the Connect button:

3. Next, select the Polar option:

A screenshot of the sync-partners of SportTracks fitness software

4. You will be taken to the Polar Flow website where you will be asked to authorize SportTracks to access your account. Click the Authorize button (you may need to enter in your login credentials).

After you authorize, SportTracks will be able to import any new workouts you complete in the future. A limitation in the Polar Flow API prevents SportTracks from being able to import your past workout history.

Devices compatible with Polar Flow + Auto-Sync

We've been wanting to make this integration with Polar for a long time, and we're excited to bring it online and offer it to you. We love giving our customers as many training options as possible, and welcoming Polar to our family of hardware partners is a major step forward toward this goal.

How To
https://cdn.pbrd.co/images/GDGBYN8.jpg

Training with TRIMP

$
0
0

Even simple workouts can create massive amounts of data when you use technology in training, and if your goal is to improve performance  properly utilizing this data is essential. Thankfully, learning how to do this in SportTracks is easy, and using your Effort score is a great example of this.

Your Effort score can easily be found at the top of your Workout Detail pages, and it can be added to the SportTracks Workouts page as well. Similar metrics can be found on other fitness platforms, such as TSS® on TrainingPeaks®, or the Suffer Score® on Strava®. It's intentionally called Effort in SportTracks to be as straightforward and non-confusing as possible.

Like the tools you'll find on other platforms, Effort is based on the Training Impulse model that was developed by the late Eric W. Bannister. Training Impulse, or TRIMP, helps you measure and evaluate the impact of your workouts and races.

Photograph of a female athlete running uphill with the SportTracks Workouts interface in the background

TRIMP scores were used to manually create Training Load charts decades ago, but because SportTracks automatically creates a much more elaborate and accurate Training Load chart for you, these scores can be used to benefit your training in other, less time-consuming ways that are covered below.

What makes Effort unique

While other platforms require you to use a heart rate monitor or a power meter to utilize their version of this metric, SportTracks will work with any data you have. It prioritizes more precise data, such as power or heart rate zones, but in the absence of those it falls back on other metrics  even if you just manually add a workout and only input time and intensity.

You can accumulate a maximum of 2 Effort points per minute in SportTracks. So, a 1-hour workout at maximum intensity could theoretically net you 120 points (although, this is rather difficult to do). Single workouts longer than 1 hour can generate a far greater number of points.

Effort vs. RPE

An interesting and informative way to use your Effort score is to compare it with RPE (Rate of Perceived Exertion). RPE is a completely non-technical metric that can only be generated by the athlete. This is how it works: at the end of a workout, you simply to come up with a number from 1 to 10 that rates how difficult the workout was (10 = the most intense).

A screenshot of the Intensity feature in SportTracks

Again, the names for metrics in SportTracks are intentionally simplified, and RPE is called Intensity. You can easily rate each of your workouts and races with an Intensity score. When you're on a Workout Detail page, select the Edit button, then select Edit Details. On the next screen you can add your Intensity rating. 

Imagine a workout felt rather strenuous, so you gave it an Intensity score of 80% (which is equal to an RPE score of 8). It can be enlightening to compare your Effort score to how the workout actually felt. If a workout was easy yet your Effort score was surprisingly high, it could be a sign that you're overtraining or perhaps in the early stages of being sick. If a workout felt difficult and your Effort score was low, it could be a sign that you need to work on your base fitness.

It should be noted that you have the ability to edit your Effort score in SportTracks. If you feel you need to change it for whatever reason, you can do so. We try to give you as many editing options in SportTracks as possible (you can even edit the weather that is automatically added to your outdoor workouts).

Targeting Effort Scores

If you're following a training plan or just building up fitness for a race, you can target specific Effort scores for workouts, in order to hit a desired training intensity. When you add planned workouts to your SportTracks Calendar, you will be given an estimated Effort score based on the details of the workout you're adding.

The workout planning feature in SportTracks fitness training software

You can do your workouts with a targeted Effort score in mind, but it helps to have an understanding of where they tend to land (by comparing them to RPE or analyzing past workouts). As you're executing a workout, you can intentionally increase your intensity in order to get a higher score. So in addition to helping you gauge your fitness, Effort can be a motivational tool.

How to get the most accurate score

The most accurate Effort scores are based on the power, heart rate, and pace zones that are found in the Training Options section of SportTracks. In order for your Effort scores to be finely tuned, you need to keep these training zones as up-to-date as possible in your profile.

You can determine your current training zones by yourself with the following tests:

  • Running: Execute an LTHR test. This single test will determine your current thresholds and zones for heart rate, pace, and if you have a Stryd running power meter — running power as well.
  • Cycling: If you have a power meter on your bike, execute an FTP test. You can determine your cycling HR zones by doing a 30-minute version of the FTP test, and using the average HR from the final 20 minutes.
  • Swimming: A clock and a pool are the only things you need to determine your swimming pace zones, however, a bathing suit may be necessary.  

As your fitness increases or decreases, your zones change. That's why it's important to test them every six weeks. When you update your zones, your Effort scores will be calculated based on the current settings. Likewise, when you add or remove zones (such as changing from five to seven zones), your Effort score will be calculated differently. This is important to keep in mind when you revisit older workouts for analysis.

If you have any questions, or if you would like to share how you use Effort, we would love to hear from you in the Comments section below!

TrainingPeaks® and TSS® are registered trademarks of Peaksware, LLC. Suffer Score® and Strava® are registered trademarks of Strava, Inc. Zone Five Software is not associated with Peaksware, LLC. or Strava, Inc.

How To
http://cache.sporttracks.mobi/blog/images/2017/08/train-with-trimp-female-runner-photo-cover.jpg

New workout comparison tools!

$
0
0

We have excellent news... We've taken a big step forward in our mission to provide you with the most powerful fitness analysis tools on the planet by rebuilding the Compare section of SportTracks! If you haven’t visited this tab recently, give it a look:

An image of the workout Compare tab in SportTracks fitness software

You will immediately see an assortment of similar workouts and two drop-down menus. The menus help you to find workouts based on various similarities, and outdoor workouts with GPS can be filtered by location:

An image of the workout comparison selector in SportTracks

The workouts are ordered with the most recent appearing first. The colored bars under the metrics of each workout indicate the quality of the match, with green being good, and red being poor. The size of the bar also indicates match quality: the shorter the bar, the stronger the match.

You can also find specific workouts by pressing the new Select button:

The workout comparison select tool in SportTracks fitness software

This opens a screen that enables you to scroll through all of your workouts, which are listed with the most recent appearing first. When you find one that you want to compare, simply select it. If you want to filter this list by other criteria, it can be done on the SportTracks Workouts page (explained later in this post). 

Selecting a workout brings you to the all-new comparison page:

The new workout comparison page in SportTracks fitness software

The summary boxes near the top show the difference between the metrics in the larger font, with the two workout values below in a smaller font. The main workout is always on the left, and the one it's being compared to is on the right. However, if you press this switch button, the metrics instantaneously get swapped:

A screenshot of the workout compare switch in SportTracks fitness software

You can select the boxes to easily change them to another metric for comparison. SportTracks remembers your customization by primary sport type (running, cycling, swimming, etc.)  so you don't have to redo these every time you compare.

The selected metrics on the chart are overlaid. Data from the main workout is shaded-in, while the workout it's being compared to is a line (unless you hit the switch button). Like the main chart on your Workout Detail pages, you can adjust the smoothing, zoom, and select Distance or Time at the bottom.

The workout offset adjustment tool in SportTracks fitness software

In the upper right you'll find another powerful new tool: you have the ability to adjust the offset of the compared workout! If your sessions didn't start at the exact same time, you can easily line them up. Hit an arrow momentarily to nudge, or hold it down to advance faster. 

When you hover over the chart, the difference between two values is displayed. In addition, you can click and drag to select a segment to show the range difference.

Compare from the Workouts page

The Workouts page in SportTracks enables you to quickly create custom lists of your workouts, so you can easily compare your performance over time. Filtering this page by Sport, name, and various metrics is fast and easy. You can also quickly change what data is shown, as well as perform bulk edits of your workouts.

Bulk edits are started by pressing the Select button in the top right side of the this page, and this is also how you access the new workout comparison features. After you press this button, a deactivated Compare button appears. If you select two workouts, the Compare button activates:

A screenshot of the Workouts page in SportTracks fitness software

Pressing the Compare button brings you to the new workout comparison page. 

The power of repetition

The practice of repeating identical workouts is common in endurance sports, whether you're conducting routine threshold tests, or repeating a course to determine if your efficiency has improved. The new comparison tools in SportTracks add new levels of depth and insight to this fundamentally important type of post-workout analysis.

We sincerely hope you enjoy these features, and we would love to hear what you think of them in the Comments section below...   

How To
http://cache.sporttracks.mobi/blog/images/2017/08/workout-compare-tab-cover.png

What is Tapiriik?

$
0
0

If you track workouts with mobile fitness apps like Strava or RunKeeper, you can easily send these workout files to SportTracks with an excellent (and free) website called Tapiriik. This blog post explains everything you need to know about this procedure.

When you first visit www.tapiriik.com, you’ll immediately notice its dark and moody color scheme, and you’ll see words in foreign languages. Even the name of the site — Tapiriik — feels alien and unfamiliar. Don’t worry! It’s actually very cleanly-designed and easy to use.

An image of the unusual language on the Tapiriik.com fitness website

The main body of the Tapiriik homepage is a grid of fitness icons. To start using it, you simply select one of them. Go ahead and select SportTracks:

An image of the fitness platforms that are integrated with Tapiriik

You need to authorize Tapiriik to access SportTracks. If you’re already logged in, you will be brought directly to the authorization page. If you’re not, you will be brought to the SportTracks login page (logging in brings you straight to the authorization page).

Select the Yes, I authorize this request button:

An image of the screen where you authorize Tapiriik to access SportTracks fitness software

After you hit that button, you will be taken back to the main Tapiriik screen. Notice that the SportTracks icon is now in a separate section above the others:

An image of the Tapiriik website being connected with SportTracks

You now need to select a second service to sync with SportTracks (Strava, RunKeeper, Endomondo, etc.). You will go through another authorization procedure, and afterward you can start using Tapiriik.

When you visit Tapiriik.com, you will see a Sync button at the bottom. When you press it, Tapiriik will share the workouts from your mobile app with SportTracks.

A few things to keep in mind:

  • If your mobile fitness app is set to Private, Tapiriik will not sync your workouts by default. You can, however, go into Tapiriik's settings and change it to accept private files.  
  • You need to visit Tapiriik.com and press the Sync button every time you want to sync. There is a paid version of Tapiriik that will automatically sync for you. This costs a reasonable $2 USD a year.
  • Sometimes it can take time for Tapiriik to sync your services. However, sometimes it happens very quickly. Regardless, don't expect your files to transfer instantly.

Wrapping up...

Having the option to track workouts with mobile apps can be convenient. When you're away from your tracking devices but you want to workout, you can still easily record your activity with your phone. Our integration with Tapiriik is just one of the many ways that SportTracks strives to give you the most workout options possible.

How To
http://cache.sporttracks.mobi/blog/images/2017/08/what-is-tapiriik-logo-cover.png

Sync with FitnessSyncer

$
0
0

If you track with devices from Garmin, Polar, and Suunto, loading these workouts into SportTracks is effortless thanks to the automatic sync integration. But what happens when you don't have them with you, or the battery is dead before you start? The solution is to record your activity with a mobile app like Strava or RunKeeper, and then automatically send it to SportTracks with a service like FitnessSyncer.

FitnessSyncer seamlessly syncs all of your data, no matter the source. It's free to use for up to five sources (mobile fitness apps, devices, etc.). You just create an account, then add a source for the data you want to pull in, and authorize FitnessSyncer to access this information. Loading acitivities can take time depending on how much data you have, or the particulars of the service it's coming from.

Advanced features and filtering

Some people use a similar tool called Tapiriik for this functionality. While Tapiriik is great for its simplicity, FitnessSyncer offers more advanced features and the ability to filter data.

A feature called "Synchronize Destination Task" compares the data from your sources with the data in your destinations and will only send unique data when it synchronizes. This automatic synchronization happens once per day on free accounts. 

A screenshot of FitnessSyncer software

One of your fitness tracking apps may have data that you don't want to import or publish because it's irrelevant to you. FitnessSyncer allows you to add filters to sources and destinations. These filters operate on a data field and can be mixed and matched to fit your specific needs. You can test your filters with a downloadable sample CSV.

If you've been tracking your health and fitness data for a while, you probably have a large library of files collected on your hard drive. You can download the free FitnessSyncer Uploader for Windows or macOS to get those files into the cloud so you can send your data to other services, save data from devices or apps that are inaccessible or unsupported, and consolidate your health and fitness history in one place.

Don't need synchronization services right now? FitnessSyncer can also be used for backing up your health and fitness activities, both within FitnessSyncer or by creating backups of your data in DropBox, Google Drive, OneDrive, and Amazon S3.

SportTracks is all about options. You have the freedom to use various tracking devices and apps, and with Tapiriik and FitnessSyncer, you have two great options for getting all of your fitness data uploaded for advanced analysis.

Contributed by Eric Theriault from FitnessSyncer

How To
http://cache.sporttracks.mobi/blog/images/2017/09/sync-with-fitnesssyncer-logo-cover.png

Is your marathon training on target?

$
0
0

If you chose a reasonable goal at the start of your marathon training, you may be wondering if you're on target to reach it. (If your goal is to run 26.2 miles in 1:45, we applaud your ambition — but you're likely going to be disappointed). It's natural to be curious if your training plan is being effective. This article explains some methods you can use to find out.

Is your goal realistic?

You likely have a "goal time" for your race, however, randomly picking it isn't advisible. There are accurate ways to determine your time and pace, both of which are explained in our post about Setting a Marathon Goal Pace.

If you picked a reasonable goal, you likely started following an appropriate training plan to achieve it. Even though you may be hitting the prescribed amount of distance and intensity each week, you may still want to know if it's going to pay off on race day. Here's what you can do...

Measure your progress

Most marathon training plans feature a base phase where you concentrate on building your aerobic efficiency and endurance. As you get closer to the race, they typically ease up on distance and focus more on pace and threshold training.

Runners usually start to wonder about their goals when speedwork takes priority over distance. It's logical why this happens: suddenly you're not running as far, and questioning how you're going to be able to crush an entire 26.2 miles.

A female and a male running outdoors

Get in tune

Training plans often encourage paricipating in "tune-up races" around four weeks from your marathon, and the half marathon is the most common distance. This event is long enough to put your endurance training to the test, but not so grueling as to require prolonged recovery and interfere with your main race.

This is an ideal environment to test your fueling strategies (where, when, what, and how much to eat and drink before and during the race). You can also use it as a dress rehearsal for your marathon by wearing and using the same gear that you plan to use in your marathon.

In addition practicing using cold Porta-Potties in the wee hours of the morning, a tune-up half marathon is fantastic for testing your marathon-goal pace. However, this requires a lot of self-control. Races come with a boost of competitive energy that you don't get in training, and it will be very tempting to run faster than your marathon-goal pace. Don't give in.

Use the extra energy of the race atmosphere to test how long you can comfortably sustain your marathon-goal pace. If possible, try to maintain it for the entire duration. You should feel good at the finish like you still have lots of gas in the tank. Faltering is a sign that your goal time may need adjustment.

A screenshot of SportTracks fitness tracking software

Compare and contrast

You can analyze your current progress by comparing a recent effort to a similar workout that you completed earlier in your training. You want to look for obvious things like faster paces and times over the same courses and distances (while taking weather conditions into account), but it can also be telling to compare stats like Aerobic Efficiency and your Efficiency Index (EI requires a running power meter).

Trends to look for:

  • Higher Aerobic Efficiency scores
  • Higher Efficiency Index scores
  • Faster paces and shorter times 

As for what kinds of workouts to compare, LTHR tests can be informative, due to their "all out" nature and the fact that you should be redoing this test every six weeks or so. It can also be interesting to look at identical Ladder workouts from different parts of the season, as they tend to cover a range of intensities and interval durations. However, for the most accurate Aerobic Efficiency stats, you should only compare longer, sub lactate/anaerobic threshold workouts.

Be the operator of a running calculator

You may have used a running calculator at the beginning of your marathon training to determine an accurate goal time and pace. It can be interesting to revisit it at a later stage to see if you're improving. Enter the distance and time from a recent tune-up race, or a training run that mimicked a race-like atmosphere (one of the benefits of organizing early morning group runs with starting points that require a vehicle to get there). The time that the calculator spits out will tell you if you're on target.

Do you have a method to test your training that isn't mention here? We would love to hear about it in the Comments section below. Thanks!

Training
http://cache.sporttracks.mobi/blog/images/2017/09/is-your-matathon-photo-two-runners-cover.jpg

New gear-tracking features!

$
0
0

Gear tracking has been a part of SportTracks for a long time, but we often add new features to make it even more useful and informative. A bunch of these little updates were released this month, and now we're going to show you how to use them...

Interactive gear history charts

The gear history charts in SportTracks have always been interesting  seeing your usage visualized quickly highlights periods of inactivity, regular use, and surges. With the new update, you can now hover over these charts to see the total usage at exact moments, or click and drag to see the usage during a selected timeframe.

Screenshots of the new gear history charts in SportTracks endurance sports training software

New "Workouts" tab on your gear pages

As you can see in the screenshots above, your gear items have neatly organized tabs for Parts, Notes, History, and Workouts. The Workouts tab is new, and it's exactly what you think it is: it lists every workout you've done with that specific piece of gear.

A screenshot of the new gear workouts tab in SportTracks endurance sports training software

Sort your workouts by gear usage

Your Workout page has a powerful new sorting filter in its menu: Gear! In addition to sorting your workouts by Sport, Pace, Distance, and more, you can now list your activities by the equipment you used to execute them.

Which shoes did you wear in that fast half marathon? Do your swim times differ in your jammers compared to your tri shorts? Answer these questions and plenty more with a few short clicks.

A neon-green colored Asics running shoe against a black background

You can also use the new gear filter on the Workouts page to speed up bulk edits. Forget to add a new tire to a bike? After you add it to your Gear page, simply filter your workouts by the bike frame, then hit the "Select" and "Edit" options in the upper right of the Workouts page to add the new tire to your activities that incuded it.

As always, we hope you like these new, little features, and that they enhance your training and racing in small, yet meaningful ways! 

How To
http://cache.sporttracks.mobi/blog/images/2017/09/new-gear-tracking-running-shoe-photo-cover.jpg
Viewing all 221 articles
Browse latest View live