If you read our previous post on the new calendar customization features you probably also noticed the new option to show training load data. In this post we’re going to explain how and why you would want to see training load metrics within the calendar view.
Remind me what training load is again?
Training load is a mathematical model which crunches through your workout history and shows you three metrics over a time-based chart:
- Fitness: How trained your body is
- Fatigue: How tired your body is
- Performance: The difference between your fitness and fatigue
You can read much, much more about training load in our three part series, starting with Part 1: Science, History and Application. The TL;DR version is:
The Training Load model predicts your overall performance level at a point in time.
For historical time periods, the training load model is going to run off your actual, completed workouts – measuring the intensity of every second of your workout. For future time periods, the model will use any workouts you’ve planned, with an estimate of the duration and intensity.
A new, integrated view
Many solutions, including SportTracks, present training load data using a “One Big Chart” approach. In SportTracks you’ll find the Performance and combined Fitness/Fatigue charts on the Health page. These give you a quick holistic overview of your current body state, as well as historical trend lines, but are lacking context. You can graphically explore the charts to look at details for a particular time span, but in a sense… it’s not “integrated” with your workout details.
Moreover, since the predictive model works off future planned workouts, to get an accurate picture of where your performance will be in the months leading up to your race, you’ll need to add those planned workouts. And probably edit and tweak them as your plan progresses to reality. We’ve got rich features for adding planned workouts in the calendar – drag n drop, templates, repeating workouts – it made perfect sense to add an integrated training load chart.
Showing training load metrics
To show training load metrics in your calendar, go to the monthly view, click the “Customize” button, and drag any of the metrics to the top of the list: Effort, Fitness, Fatigue, or Performance.
Keen readers will note that this is the first time I’ve mentioned Effort. The training load model has three outputs and one primary input: Effort. So while you’re looking at the predicted values, you probably also want to see the total effort for each period. We won’t cover the details of effort in this post; think of it as a combination of workout duration and intensity, and if you want more details go read that 3-part series linked above.
Training load data appears on the monthly view in several places, described below:
Weekly totals
Below each week in the calendar you’ll see a weekly summary showing the total effort during the week and the values for fitness, fatigue and performance at the end of the week. Recall that for historical periods, these are modeled from actual completed workouts, and for future periods these are modeled from planned workouts.
Sidebar: Month totals
In the calendar sidebar you’ll see the total effort or training load values as they will be at the end of the month.
Sidebar: Sport totals
You can also see your total effort for the month by sport type if you’ve chosen this in the customization dialog.
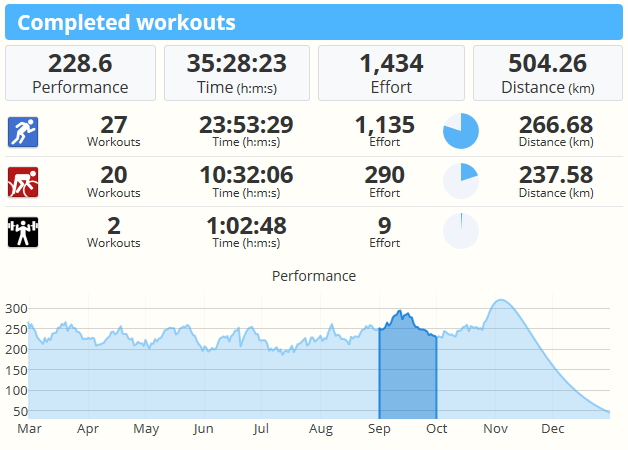
Sidebar: Trend chart
The final place you can see training load data is in the trend chart which appears below the breakout by sport type. To view the chart for a particular metric simply click the total block in the sidebar. Since effort is a total you’ll see the accumulated data in a bar chart, whereas training load metrics will be a daily trend chart. The current period is highlighted in a darker color.
Using the charts within the calendar
If you’ve started playing with the features described above you’ve discovered the integrated training load charts work just like summary totals for distance, time, etc. You can navigate through different periods – to the past, or future, and select to view charts over year, month, or week. You can bring up multiple browser tabs or windows and navigate to different seasons to compare past performance. For weekly and monthly views, your charts appear right there alongside the actual completed workouts or planned workouts.
Speaking of planned workouts – if you start editing your calendar you may notice that the training load charts are not just integrated, they’re interactive too. Add, edit or delete a planned workout and the view will be refreshed to show the new trend lines and predicted ending values. Lay out your future workouts and watch the predicted performance raise to where it needs to be on race day.
With integrated planning and interactive training load charts, the SportTracks calendar view is nothing less than pure awesome.