Quantcast
Channel: SportTracks blogs
Viewing all 221 articles
Browse latest View live

Android ANT+ Weight App

$
0
0

Five years ago Garmin started to promote a new dimension in health and fitness monitoring by adding support for ANT+ composition monitors like Tanita BC-1000. The first watches to add support for it were the FR60 and Forerunner 310XT; but soon more devices followed like Forerunner 70/210/610/910XT or Edge 800/810. However, from one day to the next, Garmin killed off support for them in new devices going forward, leaving many owners with nothing more than an expensive paperweight.

Now Android users have an alternative with the ANT+ Weight Scale Display app. The app is capable of reading the body composition metrics that are transmitted wirelessly from ANT scales.

It works both with built-in ANT+ chip devices and using ANT+ USB sticks, offers you a quick and easy way to download all your health data stored in Garmin Connect, and now it integrates with the health measurements data in SportTracks.


About the app

Depending on the model of your weight scale you can get all or some of these metrics:

  • Weight
  • Body Fat %
  • Body Water %
  • Muscle Mass
  • Physique Rating
  • Basal Metabolic Rate
  • Active Metabolic Rate
  • Metabolic Age
  • Bone Mass
  • Visceral Fat

The app is multi-user and it is a much more convenient way to track the whole family’s health. Just select who is being measured and the app will keep a separate history log for them.

You can also examine your evolution with different graphs offered by the app. Sync to SportTracks is as easy as a few clicks.

Compatible products:

  • Tanita BF-2000 IronKids
  • Tanita BC-1100F
  • Tanita HD-400F
  • Tanita HD-351ANT
  • Tanita BC-1000
  • Tanita BC-1000plus
  • Tanita BC-1500
  • HMM SMARTLAB FIT+
  • HMM SMARTLAB FIT W
  • A&D Medical UC-324ANT


ANT+ Weight Scale Display at Google Play

Shop for Tanita Weight Scales at Amazon.com


News
http://cache.sporttracks.mobi/blog/images/2015/04/ant-weight-scale-app-background.png

Running Watch Accuracy Test

$
0
0

I just got home from Boston after running the weekend races. I took my trusty FR620, FR920XT, Fenix3 and SirfSTAR GPS logger with me and bought a TomTom Runner at the expo just to get one more data point for the comparison run that was not Garmin. My hypothesis before the running was that the Fenix 3 would do great with Boston given it's relatively straight line running course with very few turns and it would do better than most watches in downtown thanks to Glonass. I also suspected that the FR920XT would probably do just as good if not better. So how did they do?

I ran both the 5K then two days later the marathon. The 5K is strictly in downtown with heavy building cover and runs the last mile of the marathon course under these tough conditions.

The 5K weather was perfect, clear skies, full sun, as good as it gets for a race and for GPS. The marathon was full overcast with moderate to heavy rain throughout the race with stiff headwind, basically the worst you can have for a race or GPS or pretty close to it. It turned out pretty good to have both of those conditions as far as GPS reception goes as it really tells a better story. Please ignore my times and the horrible positive split in the marathon, given that I ran a total of 100 miles in the last 3 months with the longest run being a 10 miler due to injury has something to do with it. But let's look at the data...

Here are the distance differences relative to the FR920XT which I used as reference:

LoggerFR620Fenix3

You can see that the Fenix 3 measured the shortest while the logger measured the longest which is no surprise, this has been the case in all my testing so far. What you can see is how the Fenix 3 cut off the turnaround on Commonwealth while the other units did way better on that turn. The underpass did not pose a huge challenge to any of the units. The turn to Hereford looks pretty decent on all units even if the Fenix 3 and the FR620 were offset form the other two. Once on Boylston the story changed and you can see that GLONASS really came through and made the Fenix 3 and the FR920XT shine. Overall I think these tracks look great and as good as anyone could expect from these units, the only caveat being that it seems like the Fenix 3 has to resort to heavy filtering to achieve this look which ends up costing in turns.

Here are the distance differences relative to the FR920XT which I used as reference:

LoggerFR620Fenix3TomTom Runner

The logger measured way longer than anything else and it also seem to have lost its marbles at the 2 hour mark for about 7 minutes where I see no real reason for it. The logger was in a front pocket of my running shorts and it very well could have had something to do with my shorts being soaked from the rain by this point but it picked up and recovered after the incident.

If we zoom in and take the Logger's data out of the view then you can see that the rest of the units tracked close, within 500 ft of each other for the entire race with TomTom measuring the shortest, The FR920 the second shortest, then the Fenix 3 and finally the FR620. This is kind of what I expected since there were no turns for the Fenix to lose distance over the FR920 and I still thin kthe 920 is more accurate for distances. The TomTom's measurements while shorter than any of the others seem to be the closest to the actual distance and the track looks really good. Mind you, this is all in full overcast and pouring rain for the most part.

LoggerFR620Fenix3TomTom Runner

Things are looking good overall until we get past the Newton Hills and start rolling down past the cemetery where the Fenix 3 decided to take a detour thanks to multipath and some taller buildings on the right side. Once we got to Fenway Park the situation for most units became too much to bear and things got ugly. I'm actually quite shocked just how ugly they got. Boylston street was a disaster for pretty much all "GPS participants" in this race and the Fenix 3 fared just as bad as an FR620 without GLONASS. The FR920XT hanged on for dear life and did the best it could in the conditions and the TomTom unit really put on a valiant effort when compared to the abysmal performance of the GPS logger, the Fenix 3 and the FR620.

Even with all these route distractions the distance measured by the Fenix 3 on the watch were not bad, it claimed that I ran 26.38 miles while the FR920XT said it was 26.35 miles both of which are as close as anyone can get on a marathon. The TomTom said it was 26.42 miles while the FR620 reported 26.47 miles during the run. I prefer to concentrate on these numbers rather than the re-calculated numbers by mygpsfiles or SportTracks as those are not the ones I run/pace off of.

In SportTracks the distances were:

WatchDistanceDifference
TomTom26.42matched the watch reported distance
FR920XT26.520.17 longer
Fenix326.680.3 longer
FR62026.780.31 longer


Conclusion

From last weekends running you can see that weather conditions can have a tremendous effect on GPS reception quality, especially when the GPS reception is already compromised by tall buildings or tree cover.

The Fenix 3 filtering is still the same (ran with the FW3.2 for the marathon, FW3.1 for the 5K) and it tries to help with the sub-par quality of the GPS track that it might produce otherwise.

A $100 TomTom without GLONASS performed almost as good as the FR920XT for the run and is definitely better than the Fenix 3. If you're the kind of guy who'd like to see the same number being calculated everywhere then TomTom is the watch for you as it was the only contender that matched its in-run distance with the post-run distance.

I think the FR920XT is still the king of Garmin watches and I'm definitely not ready to sell it just yet. The Fenix 3 has a long way to go to catch up to the FR920XT.

However a log from a friend of mine who ran a much better Boston than I did on Monday with the Fenix 3 both GPS and time wise so it can very well be a large variance between unit to unit on the Fenix 3. This is his second Fenix 3, the first one he returned because it was measuring short on his tree covered city park route and the new one's serial number was only a hundred or so different from the old one. This would also explain why some people report absolutely zero problems while others report serious problems. However on his run it seems like the ANT+ stack died 2 hours 11 minutes into his run as his cadence measurements took a serious change (switched off of HR+RUN) and his temperature rose (switched from Tempe to internal) and his HR data went away.

Speaking of Temperature, my Tempe stayed connected the whole way and I did lose it only a handful of times in the entire run. I think it should be an easy task to filter out these spikes from the log via a firmware update and I also think it is absolutely necessary for Garmin to do so as the spikes are annoying but not as annoying than the huge variance between the two Fenix 3 tracks I just posted which is the most concerning problem of all.

Original files: https://dl.dropboxusercontent.com/u/...Boston2015.zip

Another thing that also happened is that according to my Fenix 3 I set 8 new records on this run, one of them being the fastest mile in 0:00 (yes, zero zero) and the fastest 5K in 15:56 as well as 40:53 10K and 1:33 half, none if which were part of this run. So there is something seriously screwed up there too.

I wonder if the fact that I used a course navigation during this run had anything to do with any of these things, including the massive disparity between my GPS track and my friend's and the disparity between the log quality of Saturday's 5K and the marathon. Now that I looked at the track closer it almost looks like that GLONASS did not work even though I had it set to be on.

Read more Garmin Fenix 3 reviews on Amazon.com

Community
http://cache.sporttracks.mobi/blog/images/2015/04/garmin-620-920-fenix3-tomtom.jpg

Personal Records

$
0
0

Today we are thrilled to announce the public release of our brand new entirely redesigned personal records page. The new design takes the idea of a "trophy room" to a whole new level with some innovative features we think you'll like. This is a big feature release so be sure to read through to the end to get a full picture of everything you can do.

Interactively explore your PR history

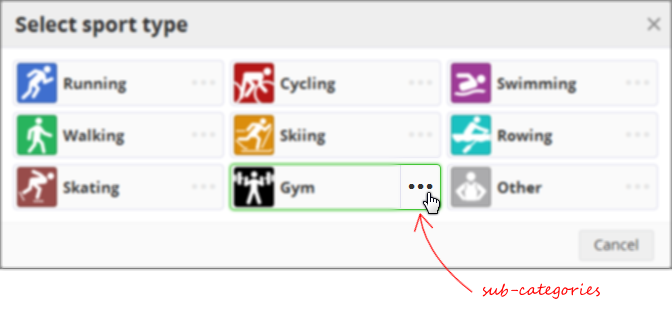
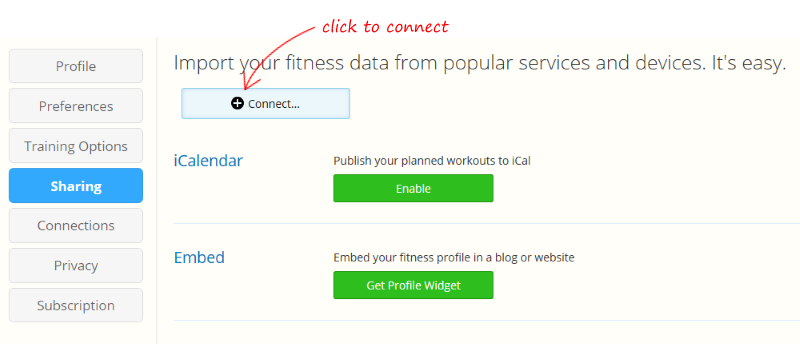
When you visit the new PR page, you'll immediately notice a few new buttons at the top. You can now filter your data by sport and by date.

It seems simple at first, but this is an extremely powerful new way to look at your best efforts seasonally. For example, you can quickly filter by Cycling and click the previous year button to see how your Critical Power progressed over the year. We also show your estimated FTP for the time period, as well as your fastest times at common race distances.

Explore your progression through time

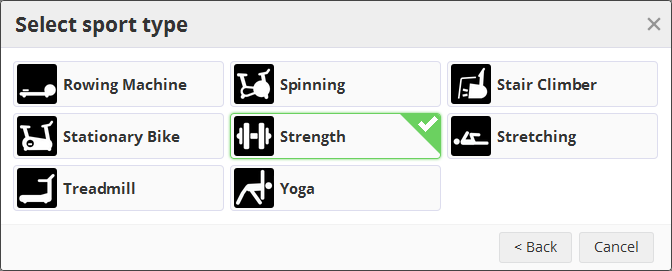
Below the header section is an entirely new visualization we've created to show your PR progression over time. Let me introduce you to the PR Timeline:

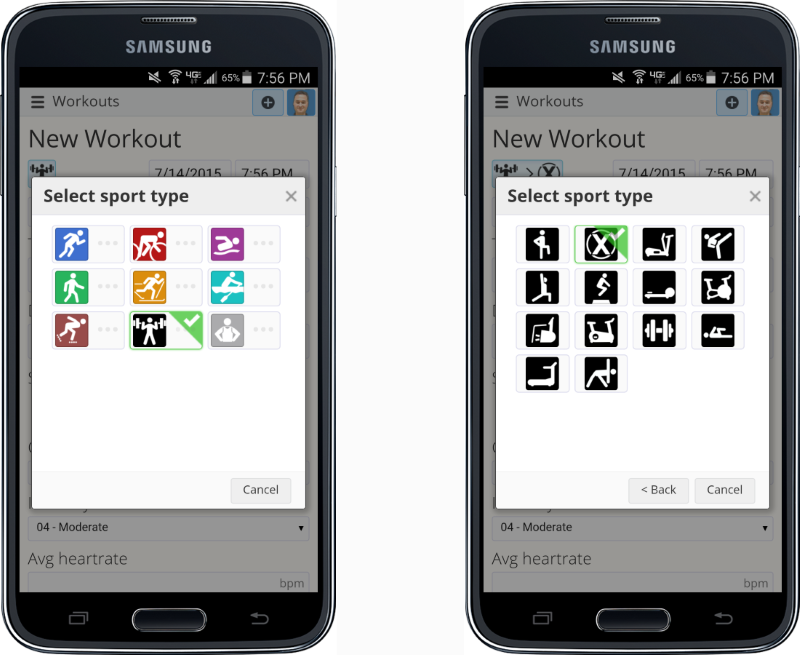
In the PR Timeline you'll see a circle for every workout where you broke a record during the time period. Move your mouse over the PR Timeline to highlight a PR stream for a particular record. For example - below is an illustrated history of every time I broke my 5K running PR:

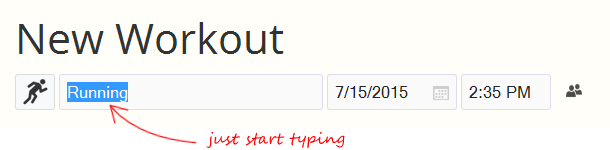
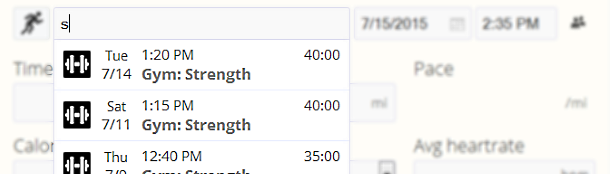
I've got records all the way back to my first race in 2004 with my Forerunner 205 to my current record which was (sadly) in 2010. Move your mouse over a particular record to get more details, and a link to the workout:

The timeline reflects any sport and date filtering you've added. The image above is a great illustration of how you can use this. I haven't broken my 5K time (22:24) since 2010, but I did have a nice 8K in 2014 and I'm curious how that season stacked up. To find out it's as easy as filtering by 2014 and moving my mouse over the PR Timeline:

Ok... I was off by 1m 29s, not great. But what if I had only missed my PR by a second or two? You'd never know this from a PR page that only shows your best "all time" workouts. With our interactive timeline, you can reveal seasonal best efforts that may have otherwise been hidden.

~That's actually pretty cool~

You can also see from above that day I had seasonal PRs in every other distance (notice the vertical line of circles). That makes sense, I didn't have any other serious races in 2014.

Below the PR Timeline you'll see two columns of records - workout and time based.

Workout (segment) records

The left side should be familiar - this is the standard list of distance-based records you see in pretty much every app. But we've also made a significant leap forward here. Before the app only calculated your PRs if the entire workout distance matched the target distance. PRs are now calculated based on every portion of your workout that meets that minimum distance - what we lovingly call "segment records".

What does this mean in plain terms? You can PR a 5K (or 1 mile, or 800m) at any longer distance  - whether that is a 10K or marathon, we'll search the entire workout for your fastest segments and that will now "count" as a PR if it's faster.

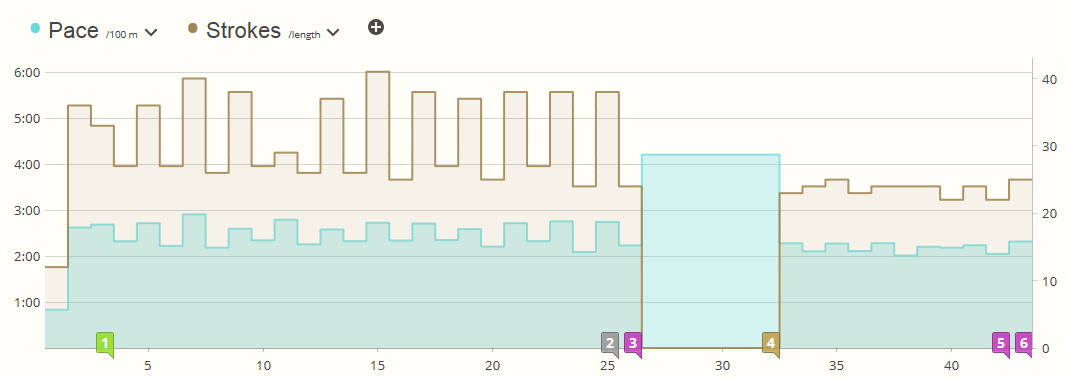
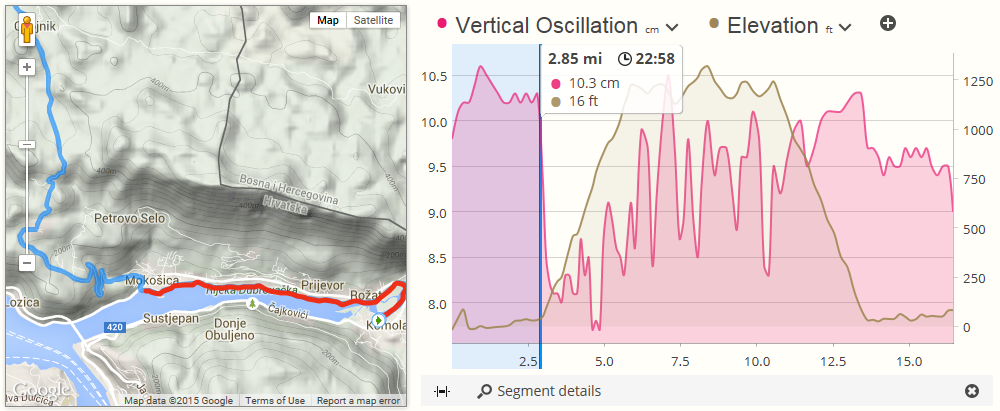
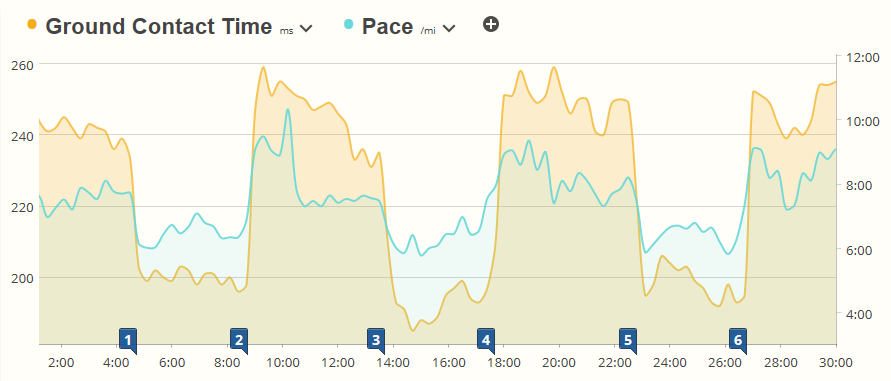
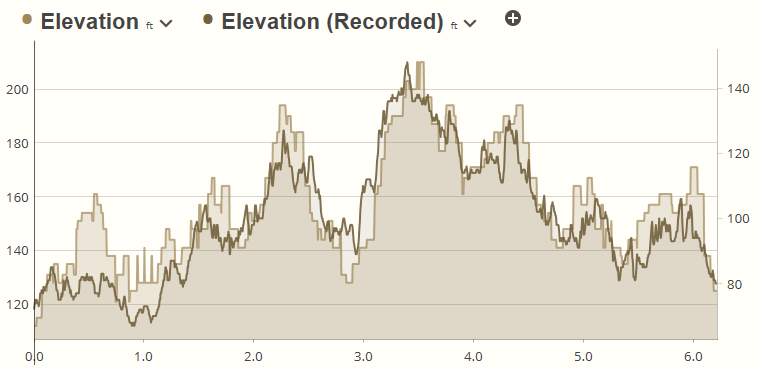
In addition, when you click the PR (from the table or the PR Timeline) and zoom over to the workout you'll see the fastest segment conveniently highlighted in the workout details - on the chart, in the map, and in the browser URL which you can share with your friends.

At this point if you're following closely, you may be asking yourself - why is his best 1 mile PR in the last mile of an 8K race?!? There is actually a story to that which involves a bit of friendly competition - another reason why these new interactive PR features are so cool.

A note about official race records and historical records before you started tracking with GPS.

While the system will calcualte every segment record within a workout, you can also "override" a faster record by manually editing the workout and entering the exact race distance and chiptime. This is useful if for example the GPS bonked and came up short on your marathon, not giving you credit for the last 0.1 mile - just go in and edit the distance to 26.2.

This is also useful if you're new to the system and have old records you want to manually enter. It's as easy as creating historical workouts for those dates with the correct race distance and PR time. Grab your paper notebook of PRs and click the Add Workout > Enter Details menu item to enter them.

Timely records

To the right of the distance speed records column you'll find a new set of records that are calculated from your workout history. Here you'll find the time periods where you maxed your workout totals in: time, distance, elevation gain, calories, and effort. Like the PR Timeline and distance records, these records are also limited to any sport or date filter you've chosen, so you can show records for runs, bike rides, or even skiing.

From the top to the bottom you'll find a block each:

  • Best efforts for any single workout.
  • Best efforts for any single calendar month.
  • Best efforts for any single calendar year.

And, like the PR Timeline and distance records sections, all of these records have hyperlinks allowing you to jump to the relevant time period on your calendar.

Viewing sport-specific records like critical power

When you first visit the personal records page the sport and date filters are blank. You'll see all your current records for time and distance, along with the timeline at the top.

For multi-sport athletes - this can be a lot of data to absorb in one glance. With that in mind you won't see sport-specific records until you set your filter to a particular sport. This also makes sense for records that really don't make sense to mix across sports.

A great example of this is critical power - it's only relevant for cycling. To view critical power and estimated FTP, set the sport filter to cycling.

At this point the only sport-specific metric is critical power, but new ones may come in the future.

Removing bad records

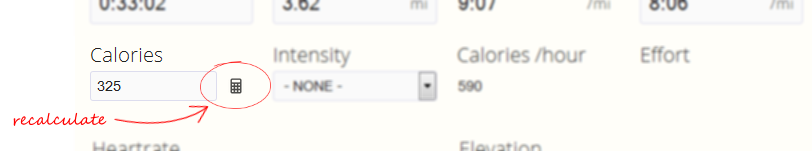
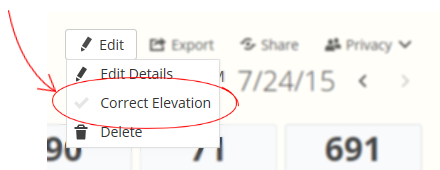
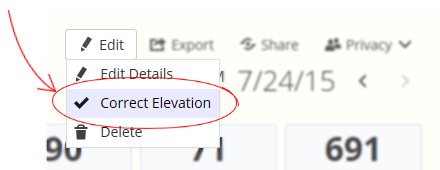
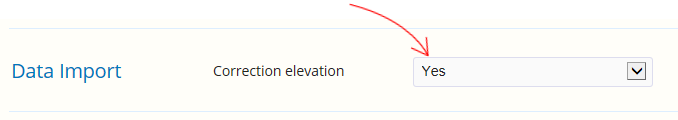
The last feature I want to talk about is correcting PR records.

The downside of sub-segment record calculations is that the system has a lot higher reliance on your data being "good". A few minutes of lost GPS signal and suddenly your 400m time is faster than Usain Bolt. A spike in your power sensor and your 60 second critical power puts you in competition with elites. There are a bit of checks in the processing routines to ask "is this even humanly possible?" - those get tossed out - but there are times when you just need to manually remove a PR you know is bad.

Not a problem. We also allow you to remove individual segment records for any calculated PR, taking them out of your "trophy case". You may have noticed a lot of small trash can icons next to your records when you move the mouse over them. Simply click the icon in the segment record table or timeline and the PR is removed.

Have a coach? Or maybe you are a coach?

As you can see above we've added a lot of new features in this release. We've also made an important improvement to our security permissions for personal records. Starting today your coach can view your personal records page - just like your calendar, workouts, health and analysis pages.

If you're a coach, this means you can go look at your athlete's best efforts, using all the same filtering and interactive features that athletes get described above, including critical power bests from last season, or two years ago, and how they compare to where your athlete is at now. Important stuff.

But wait... there's more

In the personal records page you're seeing the result of a fundamental redesign of our records processing. Records are now processed at the segment level. Records are now calculated for multiple metrics (speed, power and heart rate... so far). And we've engineered an entirely new processing pipeline for record calculation to ensure website performance remains high.

This opens up a lot of new opportunities that you'll see delivered in the future. We haven't committed to putting any of these on the short-term roadmap yet, but we'd like to get you excited about potential by hinting at features we can now add with a LOT less effort:

  1. Records notification. You just finished a run and broke a record. It would be nice to get an email telling you that, right? It would also be nice for your coach to know, and maybe your friends on Facebook too. This is especially relevant for time trials where you hit a new high in your critical power. Maybe time to revisit your FTP?
  2. Workout comparison to best efforts. It's great to see how a particular workout you just completed compares with your best efforts. Now that we calculate segment records, it makes sense to show them in workout details. For example: "This run was your 5th (of 12) fastest 10K this year".
  3. Workout CP plots compared to best. Similar to #2 above, it makes a lot of sense to allow you to overlay your best CP efforts over the CP plot on the workout details.
  4. Race predictor. You've run a few 5K and 10K races - how would you do in a half marathon? We've now got data that we can use as inputs to algorithms that predict race times.
  5. Badges and accomplishments and challenges. Hurray - you rode 500KM in one weekend!! Beast mode!! A lot of websites do this. It's not really our focus, but we can easily add badges and accomplishments into our processing pipeline if people demand it.
  6. Comparison rank. We now have all the records of your friends - and strangers in your city and age group. Showing where you rank would be an obvious next step.
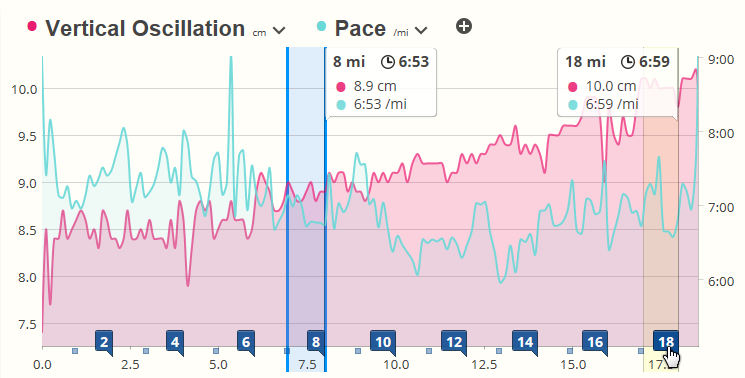
  7. More metrics! Vertical ascent records? Runstreaks? Farthest travelled between two workouts? Yep, we can add these too.

Shut up and tell me how to get this!

To access your personal records, move your mouse over your profile photo in the upper right corner of the website header and select "Personal Records" from the menu.

WHEW! This is getting into DCRainmaker territory. That's enough talk about software for now. Time to get out there and chase a few new personal records!

Questions, comments, feedback? Hit us below.

How To
http://cache.sporttracks.mobi/blog/images/2015/05/lots-of-trophies.jpg

Daily notes

$
0
0

Today we're happy to announce a note-worthy enhancement to SportTracks: Daily notes!

Daily notes are a super simple yet useful way to enhance your workout log, allowing you to record descriptive information on things that happen outside of structured workouts. If you're diligent about recording daily notes, you'll find you have a richer and more complete snapshot when you look back at your fitness history from prior years. All those intangible facts about your health and/or illnesses, stress level, what was going on with your family or at work will be right there alongside your workouts.

They're also a great way to share scheduling information with your coach, or for your coach to provide tips outside your training plan. We'll see more on that later.

Create a daily note

As previously mentioned, daily notes are super simple. Click on the calendar tab in the header. If you're in the monthly or weekly view, you'll now notice a note icon appears when you move your mouse over a particular day:

To create a note, click the note icon and enter your text:

Boom. Done. If you're not working with a coach, you can stop reading now. Go forth and enhance your diary!

Coaching features

If you're working with a coach, or if you're a coach working with your client, daily notes get a bit more sophisticated.

For athletes: Any notes you add on your calendar are also visible by your coach. As I show in the screenshot above this is a really simple way to tell your coach about your schedule and days you're not available. When your coach is adding workouts for your training plan, the note will appear right there in the plan for them to refer to.

For coaches: Just as you'd expect, you can now add notes to the calendar of your clients. This is a great way to communicate goals for off days when your athletes don't have any workouts planned, or to provide motivation in a run up to a race. You can also use this to pop up notes on the athlete's dashboard - things you feel might be higher priority than the normal notes you add to a planned workout.

The method to add a client note is the same as above. Go to the client calendar, click a day, and add your notes.

When the athlete comes back to look at their calendar, they will now see a note icon for that day. They can click the note for details, and add their own notes in a separate tab.

If you're planning backwards from a target race date a good workflow might be:

  1. Go to the date of the race and add a planned workout with the subtype "Race", with the distance and target time goals. You might want to put a link to the race website in the workout notes.
  2. Add a note one or two days prior with your "race day tips". If you're doing long term planning, you can paste in some general coaching information. When the date comes closer you can go edit the note to reflect information which is more relevant to your athlete.

Coached athlete dashboard view

The last change we made for coached athletes is adding those upcoming notes that your coach entered to the upcoming workouts section of your dashboard. If you've been reading along, take a look at how this pre-race scenario will play out on your dashboard:

When you see a coach note on your dashboard you'll discover you can click the note to view extended narrative. The dialog also includes a convenient button to instantly send a message to your coach:

Coach Z thinks everything is going well, but Homestar is not so sure he can make it through 0.262 miles:

When Homestar clicks Send, Coach Z will get an in-app notification and an email. If things are going off the rails this late, it might mean coach needs to give him a call.

Using your imagination, you can also see how this is a great way for coaches to pre-schedule a follow up note after races or time trials. A simple "How did it go?" note will prompt the client and the reply button is only a click away.

We hope these new features enhance your training and coaching experience.

~Enjoy

How To
http://cache.sporttracks.mobi/blog/images/2015/06/calendar-note-pen-and-notebook.jpg

Connecting with iSmoothRun

$
0
0

SportTracks is compatible with a wide range of GPS watches and other tracking devices, but some people prefer to use their iPhones to track workouts. We wanted to create a robust solution for these athletes, so we partnered with iSmoothRun. This is the most full-featured iPhone fitness app available, and it has our seamless auto-sync functionality built-in. 

This app is packed with advanced features, including the ability to sync with power meters, heart rate monitors and other hardware. Setting up auto-sync between SportTracks and iSmoothRun is easy. Once it's running, your workouts will automatically sync and upload to SportTracks. 

Configuration

1) Launch iSmoothRun and tap Settings in the lower right corner of the screen.

2) In the General menu, tap on Social & Export.

3) Scroll down and locate SportTracks.mobi on the list, and give it a tap.

4) On the next screen you have the option to turn on Export when saving, which is highly recommended. Tap Authorize.

5) Enter your account email address and password, and tap Log in.

6) You will be asked to authorize iSmoothRun to use your account. Tap Yes, authorize this request.

That's it! You're finished. You now have an incredibly powerful dedicated iPhone app to track your activities, and it's synced with the industry-leading fitness analysis, planning, and coaching platform.

How To
http://cache.sporttracks.mobi/blog/images/2015/06/ismoothrun-screenshot-two.png

Garmin Edge 520 Announced

$
0
0

The Garmin Edge 520 was just announced and will ship in the coming months. I wanted to be cynical about the new Edge for some reason. Perhaps it’s the British sense of wanting an underdog to win.

However the product looks so good it would be childish to put down what is clearly the best Edge yet – any bugs that arise, aside ;-)

There are a few salient points about new stuff immediately below followed by my comments and then quite a bit more info at the end of the post with images and youtube vids from the formal Press Release.

  • Compatible with Varia™ bike radar and lights
  • Edge® remote compatibility
  • LiveTrack
  • Advanced performance and power analysis, including new Time in Zone, FTP tracking, cycling-specific VO2 and recovery and cycling dynamics
  • Bike trainer profile for compatible Turbo trainer data display and control
  • On-device segment compatibility for dynamic and engaging in-ride competition
  • Connected features via a smartphone
  • Compatible with Garmin Connect™ and Garmin Connect™ Mobile
  • Compatible with VIRB® action cameras
  • Integration with Shimano Di2 electronic shifting
  • Weather alerts
  • Preloaded Garmin cycling map: no
  • Wi-Fi® compatible: no
  • Round-trip routing: no
  • Route planner: no

This is a worthy continuation of the Edge Series.

Sure some of the included ‘new’ features are new to the Edge series but are already included in other Garmin watches (eg recovery advisor). But super-new features like proper Strava integration (at an additional annual subscription cost) will be welcomed by a LOT of cyclists. The integration with all the various other bits of Garmin kit don’t excite me per se but to those of you that have that kit AND want integration – you are happy. Garmin are clearly doing their job.

I’m not sure what new bits are in cycling dynamics yet (if any) but that and VO2 and FTP stuff are generally welcomed. I’m still waiting to see a bit more intelligence in these devices with better automatic heart rate/cadence/power zones based on threshold performances and/or analytics for optimal cadences (for example). No doubt that sort of thing will come soon enough.

—————— Press Release Follows ——————

Garmin International Inc., a unit of Garmin Ltd. (NASDAQ: GRMN), today announced the Edge 520, the first GPS bike computer with Strava live segment challenges. The Edge 520 boasts a myriad of advanced analysis features including time in zone, functional threshold power, cycling-specific VO2 max and recovery time1, indoor trainer2 support, cycling dynamics3 and in-ride challenges through Strava and Garmin Connect™ segments. Additional connected features4 and a high-resolution, color (sic)display offer cyclists a complete package of cutting-edge features in a compact, lightweight device. Garmin-edge-520-gps-bike-computer“We’re excited to announce the Edge 520 and our strategic relationship with Strava – providing cyclists with the first GPS bike computer to have Strava live segments,” said Dan Bartel, Garmin vice president of worldwide sales. “The Edge 520 taps into cyclists competitive edge and offers them the latest in innovative training tools.”  

Segment Challenges and Advanced Metrics

Garmin Edge products are the only GPS bike computers to feature Strava live segments. As the first GPS bike computer with Strava live segment challenges, users can send segments directly from Strava to their Edge 520 to receive instantaneous data, compete for King of the Mountain or Queen of the Mountain titles, and more. Additionally, the Edge 1000, Edge 810 and Edge 510 will add support for Strava live segments via a software update in Q3. Users can also tap into their competitive edge with in-ride challenges through Garmin Connect segments. The Edge 520 provides new advanced performance and power analysis to maximize training efforts. Advanced metrics include time in zone, functional threshold power and watts/kg tracking, cycling-specific VO2 max estimate, a recovery advisor and cycling dynamics – revolutionary metrics that provide feedback to cyclists on their position and pedal form.

Exceptional Display and Connected Features

The Edge 520’s aerodynamic design features a high-resolution, 2.3” color display, providing ideal visibility. With up to 15 hours of battery life and compatibility with GPS and GLONASS satellites, it is built to handle endurance rides. The Edge 520 integrates with compatible Shimano Di2 electronic shifting systems5 and standard ANT+® sensors including power meters, heart rate monitors, speed and cadence sensors, the newly announced Varia™ line of smart cycling devices, remotes and VIRB. Additionally it pairs with compatible ANT+ indoor trainers for data display and control. When paired with a compatible Bluetooth® device the Edge 520 can instantly upload activities to Garmin Connect for post-ride analysis, instant sharing on social media, and with the Live Tracking feature users can allow family and friends to follow their rides in real time. Users can also stay connected with family and friends during a ride with the Edge 520’s smart notifications that display incoming texts, calls and more. In Garmin Connect users can download courses and follow them on the device, receiving turn indications throughout a ride, and compete against other cyclists on previously ridden courses. Edge 520 users can upload to Garmin Connect and download courses and segments via a PC or Mac®.

The Edge 520 is expected to begin shipping in Q3 and has a suggested retail price of $299.99 and $399.99 bundled with a heart rate monitor, cadence sensor and speed sensor. It will be the on-bike device used by Team Cannondale-Garmin during races beginning in July.

This was a guest post from the5krunner.com.

News

Editing Your Workout Data

$
0
0

One of our guiding principles at SportTracks is that users should be able to control their data. A big part of controlling your data is allowing you to edit it. It seems so simple, right? Yet amazingly, it's a feature that several popular websites don't offer, or only offer in very limited ways. In this post, I'm going to outline three ways you can edit your data to take control and structure it the way you want.

Why should you care about data editing?

As I mentioned above, several [popular] fitness websites don't offer data editing, so you might be wondering: Why should I care? There are two primary scenarios you need to think about:

  1. Annotating the data created by your watch gives you a richer fitness history.  This means better analysis, better planning, better performance, and generally more enjoyment out of the app as you review past workouts. You're here to track your workout data, right? Make sure you get the complete picture.
  2. Correcting data when your watch goes bonkers. If you're using fitness tech, sooner or later you're going to hit a glitch in GPS recording, or your HRM battery is going to die. Or you're going to stop for a beer and forget to start your watch (admit it, you've done it too). If you can't edit your data to reflect what really happened, there isn't much point in using a fitness tracking website.

Let's jump into the three ways you can edit your data, starting with direct "quick-edit" from the workout detail view.

One: Workout Detail Quick Edit

If you're looking at your workout detail, you've got a lot of options to directly edit the data right there in place without going to another page:

1. Sport. Click the sport icon to select a new sport, or categorize further into sub-sports for detailed analysis. Typically, your watch will only know about a top level sport: running, cycling, etc. Now is a great time to add detail about the particular sub-sport: trail running, indoor trainer cycling, etc.

2. Name. The workout name will usually prefill from the sport type. If you'd like to track a name for specific events or courses, click the name to enter it. We'll even auto-suggest similar names from your history to save you some typing.

3. Privacy. Your privacy is important to us. Click the privacy option to make any workouts private, or to share publicly with friends that might not be users of SportTracks.

4. Location. Click the edit button beneath the workout name to select a location. Like the name field, we'll auto-suggest similar locations you've already entered. If you've recorded an outdoor workout with GPS data, we will also suggest a location name for the GPS location.

5. Notes. Click the edit button in the notes header to add or edit your workout notes.

6. Interval Rest/Active. If you've recorded a workout with laps and you've done interval training or included a warmup/cooldown, you can also toggle the Rest/Active status of your intervals. Some watches already record this, but if yours doesn't, it's easy to add this after the fact.

The quick-edit feature on the workout detail page gives you most of what you need for annotating your data, without the bother of going to separate edit screens. And the auto-suggest features mean you don't need to worry about spelling mistakes or data inconsistencies. If you need to correct data that's been recorded, you'll want to use the full edit feature.

Two: Edit Workout

To edit data metrics beyond simple descriptive fields, such as distance, time, calories, elevation, or heart rate, etc., click the "Edit" button on the workout detail which will bring you to the full edit page.

In this page you've got full control over your summary metrics. You'll see your pace automatically calculated from your time and distance, and a calculator button can calculate your calories burned based on your weight, the sport you performed, and the intensity or speed.

You'll find the same auto-suggest options here for the name and location fields, and the address lookup based on the GPS start location along with a mini-map.

When you change sport type, the distance and pace/speed options change to your particular sport. If you want to enter distance in a different unit, it's as easy as clicking the units button.

Three: Bulk Edit

If you're coming from another system and loading your history of hundreds or even thousands of workouts, the prospect of editing every workout... One. At. A. Time. probably makes your head hurt. Luckily we've also provided a bulk edit feature in the Workouts view that lets you edit the summary information en-masse.

With the bulk edit feature, you can go back to past years data and quickly add descriptive information to your workouts. You can also reassign your workout privacy to a bunch of workouts at once. Or add or replace the gear you used. Or add the same note to a pile of workouts. Or recategorize them as sub-sports. And more. It's simply awesome.

From the Workouts view click the "Select" button to enable the multi-row selection. Select the rows you want to edit (tip: On a computer, hold down the SHIFT key and click to select a range).

Click the "Edit" button. On the summary screen you'll see options to overwrite sport, name, location or privacy.


You can also add or replace either gear or notes. When you've made your selections click "Save".

And... We Made Sport Selection Easier Too

If you tried out the new editing features you may have also noticed we updated our sport chooser. Now you can pick a sport or sub-sport with a single button click. Opening the sport selector shows the top level sports, so for example, you can quickly pick a gym workout...

...or if you want to pick a sub-sport, click the ellipsis which appears by each sport to get a list of sub-sports:

And mobile users will be thrilled to know we optimized this for phone layout. No more scrolling around...

Bonus "pro-tip"...

I'm going to give those of you that actually read this far in the post a bonus "pro tip". If you're on a laptop and in a hurry you can use the ENTER key on your keyboard to submit both the full Edit page, and the Name and Location quick-edit dialogs.

~Enjoy

How To
http://cache.sporttracks.mobi/blog/images/2015/07/editing-workout-post-img.png

Tracking Your Gym Workouts

$
0
0

Last week we released major updates to our Edit Workout page, enhancements to quick-edit, and a new bulk update feature from the Workouts page. You may have also noticed a complete redesign of our Add Workout page for manual workout entry. Today I'm going to talk about how you can quickly add manual workouts, whether in the gym, cross-training, or for those times you forgot your GPS.

Why Log Manual Workouts?

If you're reading this, odds are you're a runner or cyclist, maybe a triathlete, who is into tech and into data analysis. I would also bet that you've got a GPS or cycling computer (or maybe two, or three...LOL), a Garmin, a Suunto, or some other brand, right? Which is greatyou push start, you push stop, and all the detailed data syncs to SportTracks automatically. So you may be wondering... Why go through the work of logging your non-endurance workouts?

1. To have a complete picture of your training.

If you're cross-training, or doing gym workouts, you're spending time on fitness. You should be tracking that, as it can have an impact on fatigue, training load, injuries, and weight maintenance (as well as gear usage). If you don't track indoor workouts you might find yourself wondering why your performance a few seasons ago is so different than this season. Were you doing strength workouts or not? You don't know: you can't remember because you didn't track it.

2. It's easy, and you can do it anywhere.

With the new improvements we've made, entering manual gym workouts is a snap. With our mobile-optimized interface, you can do it right from your smartphone in the locker room. Our "smart-prefills" feature enables you to quickly duplicate past workout data with only a few clicks.

3. Other people are doing it.

Part of the motivation of our redesign of Add Workout (other than just knowing it was clunky), is it that it's a really popular feature! More than 25% of our users are logging gym workouts: 6% yoga, 5% stretching, 3% plyometrics, and an amazing 1 in 50 of our users are logging their Crossfit workouts. These athletes know the importance of cross-training, and that they should be tracking them. Now we've made it much easier.

On to the feature review!

Adding a Similar Workout (Previously Completed)

As we talked to users and designed the new feature, one thing became clear: unlike GPS tracked workouts, manually created gym workouts and cross-training are very consistent and repeated. You're doing strength training every Monday at 7:00 AM... or you've got a monthly yoga class you take with your spouse... or you're swimming in the pool two days a week to get at least some upper body work. It's at the same location, usually at the same time, the same description, name and notes as the last time you did this.

Entering a similar workout couldn't be easierjust start typing in the name field as soon as the Edit page comes up...

...and we'll show you a list of recent workouts that match it:

Clicking a workout prefills the sport, name, time of day, distance and duration, calories, location and notes. You can now go edit those fields if anything has changed, or just save the workout if only the date has changed.

Also, you don't have to pick an indoor workout, you can also select a workout you recorded with your GPS. And since you probably didn't run/ride/swim the exact time and distance down to the second or 1/100 of a kilometer, we'll round both of those to reasonable numbers.

Smart Autocomplete for Faster Data Entry

Once you've selected a similar workout or started with a new sport entry, you'll notice the entire page is now dynamic, reflecting the pace, speed, and distance options of the particular sport. For running, you'll see pace in minutes per mile or min per kilometer. For cycling, you'll see mph or km/h. Rowing distance is represented in meters, just as it should be.

On most fields we've added smart autocomplete lists. Click the time of day field and you'll see options for every half hour of the day. Go to the time field and start entering a workout duration and you'll see common workout time options. You'll be happy to notice the distance list respects your sport, so you when you enter a "1" for running, you'll have the option for a 10 mile run, while for swimming you'll see 1,000 yards, 1,500 yards, 10,000 yards (that would be an amazing pool workout, right?)

For the location field we'll search your current workout locations and give you a list of options that match as you type in the field. This feature speeds data entry of long locations, and also ensures your data is consistent in spelling and formatting. Type a couple letters, then pick the matching location from the list.

Instant Feedback on Pace and Calorie Calculation

As previously mentioned with the sport category and distance display options, we've also enabled live pace/speed calculation based on your entered time and distance. This is a great way to check your data entry (...whoops, did I really mean to run a 0:53 / mile? Probably not... or call the Guinness Book of World Records). You can also use this to "reverse calculate" a distance or time if you know for example, one of them but not the other, and the approximate pace. This is useful if you ever find yourself in a situation such as - "I can't remember the exact distance, but I know we ran for 50 minutes and Joe said we were doing an 8:15/mile pace". For you math geniuses that comes out to 6.06 miles, but you already knew that.

If you've entered your weight, you'll be happy to see we now dynamically calculate and display your calories burned for the workout based on sport METs, time and duration. If you haven't entered your weight, click the calculator and enter it. Or you can enter your calories burned manually.

And finally, we've added a few new fields to the manual workout we didn't have before that people requested: privacy and average heart rate. If you take your pulse during a cross-training workout and make a mental note, or read it off the gym machines, you can enter it here once you're done.

These features combined with the new Workout Edit features will make your manual workout entry faster and more efficient. Because aren't you busy enough already?

A Special Thanks to One of Our Users

We recently conducted a lot of design optimization, but we couldn't have done it without feedback from a key user that took an interest and helped us out. Thanks to Nick Josipovic for reviewing our design and being direct when we got it wrong, and for telling us how to make it better.

Now get out there and get tracking!

How To
http://cache.sporttracks.mobi/blog/images/2015/07/woman-red-weight.jpg

Bluetooth Fitness Sensors

$
0
0

In the Garmin world, it’s generally simple for your watch to talk to accessories such as heart rate monitors (HRM), power meters or cadence/speed sensors. Everything in that world uses the ANT+ way of communicating.

Many of us now have smartphones and, generally, smartphones can’t talk using ANT+. Instead, they use Bluetooth Low Energy (BTLE or BLE), often marketed as Bluetooth SMART or Bluetooth v4. This trend has obviously not passed Garmin by and many Garmin watches can now upload activity data to smartphones using BTLE.

However, Garmin sports devices cannot talk to the emerging number of BTLE accessories, such as the Polar Look KEO Power Meter Pedals or the Runtastic Speed & Cadence sensor. But why should they? Garmin owns the rights to ANT+, and I’m sure they would like the cosy ANT+ world to continue.

I would imagine Apple (watch) and many others might prefer otherwise. You can sense an emerging dynamic that the future of communications standards in sports devices is not clear-cut. Companies are now making key strategic decisions about product directions, the costs involved, and the potential market sizes involved. For example, Suunto recently ditched dual ANT+ and BTLE support in the AMBIT3 in favor of sole support for BTLE.

So maybe you're not sure what sports device you will own in four years’ time, and when you buy an expensive power meter now, you might be concerned about the longevity and usefulness of your investment. Alternatively, you might really like to use Strava on your smartphone when cycling and prefer to use a sports GPS watch for running, "turbo" training or swimming most of the rest of the time. Hopefully you can see that your world of sporting-device-certainty has been partially thrown into confusion by ANT+ and BTLE, and this confusion will not be resolved in the marketplace for several years.

What to do about it?

  1. Single Vendor Strategy: Well, you can stick with one vendor and be happy with any price premium associated with doing so.
  2. Dual Broadcast Technology: Some devices broadcast both protocols. So, for example, you might buy a MIO Link– a wrist-based optical HRM that transmits both BTLE and ANT+ or a 4iiii Precision Power Meter.
  3. Translate: ANT+ and BTLE are just frequencies, and one can be converted to the other. So you can then also buy a device such as a MIO Velo which, in addition to comprising exactly the same HRM functionality as a MIO Link, can convert some ANT+ signals to BTLE.

I’m going to talk a bit about the Translate option. It’s a specialist market niche and there are only really three products that I know of that are worth considering: the Wahoo RFLKT+, the MIO Velo wrist band and the 4iiii Viiiiva V100 chest strap.

MIO Velo

After installing the free MIO GO app, you pair and configure your bike’s ANT+ cadence and/or speed sensors and you're good to go. Your smartphone can now get your wheel speed rather than GPS speed and can also get your cycling cadence. Power sensors and running footpods are not supported, and unlike the MIO FUSE, data is not cached within the Velo. Note that the BTLE/BLE signal is only received by a smartphone and not a BTLE wrist watch.

I like the MIO Link and I like the MIO Velo. But I’m left wondering why, for $70 USD (or thereabouts) you just didn’t go out and buy a Bluetooth cadence sensor for your bike for a lower price. You might argue that you don’t want two sensors on your bike doing the same thing. Fair enough. But with easily attached crank-based sensors such as the WAHOO RPM or the GARMIN CADENCE SENSOR then I don’t buy that argument either.

4iiii Viiiiva V100

The 4iiii Viiiiva V100 uses the 4iiii DEVICE CONFIGURATION app to configure the HRM to pair with sensors. In addition to your speed/cadence sensors, you can also pair to an ANT+ power meter and an ANT+ footpod. The MIO Velo isn't capable of pairing with the ANT+ power meter or ANT+ footpod.

The V100 will happily talk to your iOS or Android smartphone, but it will not send converted ANT+ sensor signals to your BTLE/BLE Suunto or Polar watch.

So, if you’re a Strava smartphone app user who has invested $1000 in a power meter, then I can see it makes perfect sense to buy a V100 to leverage your existing investment.

The V100 is firmware upgradeable. Future firmware is likely to include caching with the potential of applicability to swimming. A smaller wrist-based version may be introduced (the MINI).

Look here for a more detailed review of the 4iiii Viiiiva V100. The V100 seemed the much more robust and easy to setup of the bridging products tested.

Wahoo RFLKT+

The Wahoo RFLKT+ receives almost any ANT+ signal (power, heart rate, cadence and speed), converts it to BTLE, and sends it to your iOS app. Whatever data is on the app is then REFLECTED (hence the name) back to the RFLKT+’s highly configurable display.

This is a neat take for an iPhone user. You can leave your Apple gadget secured in a dry back pocket with the screen off to save power, and you can see all of your key data on your handlebars with up to six data fields per screen.

Like the 4iiii, the Wahoo RFLKT+ may give some extra life and usefulness to your existing ANT+ power meter.

Other interesting stuff

I love looking at unusual products for one specific reason and then discovering new, great features. The MIO Velo has one of the most accurate optical HRMs for the wrist, which is great if you don’t like wearing a chest strap.

The 4iiii Viiiiva V100 saves data in .FIT formatwhich can then be used to export to other applications, such as HRV-analysis related aspects of SportTracks and FIRSTBEAT.

The Wahoo RFLKT+ will be great for iOS users whose long rides are blighted by iPhone battery restrictions.

The Velo does not support HRV data, and I suspect further that plans announced earlier in the year by MIO to include Power Meter Sensors in the Bridging Plans will not go ahead.

4iiii have stated the existing commitment to continue to enhance the V100 through firmware. There are many routes they could go down, including: caching or motion analysis as found with the Suunto SMART Belt and Wahoo TICKR-X, respectively. Also, despite appearing fairly mundane, there is much innovation in Sports Heart Rate Monitor.

Summary

To be clear about Bluetooth pairing: these solutions don’t really broadcast a Bluetooth signal. The signal is only conceptually broadcast within the pairing that has already been created between the smartphone and the device. In other words, nothing else can see it besides your Suunto or Polar gear.

It seems to me that the MIO Velo customer wants the optical HR monitoring on the wrist first and foremost. It just so happens that it’s great that cycling cadence is also passed to your smartphone to augment the GPS speed already there. Maybe you would turn off GPS to save some battery juice and use the wheel speed, or maybe you would use it indoors to get wheel speed and cadence. Maybe. I suspect that most MIO Velo users don’t like wearing chest straps.

On the other hand, the serious 4iiii Viiiiva V100 customer needs power data in a Strava-like smartphone app. Maybe they also will plan to make use of the V100 for richer data experiences for indoor running and cycling. As I see it, these cyclists would have no choice other than the excellent and reasonably priced 4iiii Viiiiva V100. No choice, that is, other than buying an expensive, new power meter.

The keen, power meter-owning cyclist who has their iPhone as a primary display may well consider security, environmental- and battery-issues important enough to warrant the purchase of a Wahoo RFLKT+.

Products discussed in this article

MIO Link Full Review
MIO Velo Full Review
MIO FUSE
Wahoo RFLKT+ Full Review
4iiii Viiiiva V100 Full Review
Suunto SMART Belt Full Review
Wahoo TICKR-X Full Review

This was a guest post from the5krunner.com.

Community
http://cache.sporttracks.mobi/blog/images/2015/07/bluetooth-gear.jpg

Why Training to Improve Your SWOLF Score is Worthwhile

$
0
0

There's a lot of interest in swim tracking and SWOLF scores, but not much information that explains what these scores mean, and how they can benefit your training. In this post, we go over what a good SWOLF score would be for a 25m pool, and why training to improve in this area is worthwhile.

If you’re not familiar with the subject, you can learn more in our dedicated What is SWOLF? post... but here’s the short version: It’s a measurement that adds the number of strokes you take with the amount of time it takes to swim the length of a pool. Like the sport of golf, the lower your SWOLF score is, the better. (Its name comes from combining the words swim and golf.)

SWOLF isn't the ultimate metric that determines whether you’re a good swimmer or not. Just think of it as a drill that can improve your efficiency and speed in the pool — and potentially give you faster times in open water as well.

In an odd way, working on your SWOLF score is similar to practicing the high jump in track and field. In order to most effectively hurl your body over the horizontal bar at higher and higher heights, you need to experiment with different techniques to figure out what works best for you.

It’s the same with your SWOLF score. In order to bring the score down, you need to experiment with different variations, intensities, and repetitions of strokes and kicks to determine what combination delivers the lowest score.

What does my SWOLF score tell me?

Athletes are judged equally on time. If you want to set a new world record in the 1500 meter freestyle, you need to do so in a shorter amount of time than the current record holder. Your SWOLF score is different because it’s a personal metric.

Your best SWOLF score gives you a personally-tailored target to shoot for the next time you're training in the pool.

Taller people with long arms tend to have lower SWOLF scores, because their larger bodies traverse the length of pools more readily. This doesn’t mean that they’re faster and more efficient swimmers, it just means that the benchmark for their personal SWOLF score may be different than a shorter athlete. Your best SWOLF score gives you a personally-tailored target to shoot for the next time you're training in the pool.

What’s a good SWOLF score for a 25m pool?

If your score is in the mid or upper 30’s, you are a pretty stellar swimmer. For example, if it took you 19 seconds to swim the length of a 25 meter pool, and you took 16 strokes, that would be a SWOLF score of 35. That’s a great SWOLF score for a 25m pool. A good score would be a little higher than that, in the low 40’s.

Remember... this a training drill, not an exact science. Different body types and effort levels can result in varying and potentially contradictory SWOLF scores. This is a tool you can use to improve as a swimmer — not a number that determines your worth as an athlete.

Now, if you start off with a running dive, or you push off from the wall and perform a lengthy, porpoise-inspired streamline to improve your score, go ahead. Just know that you’re essentially just goofing off if you do so. The point of doing SWOLF drills is optimize your stroke to achieve the fastest times, not to measure how skilled you are at being a human torpedo.

This is a great training routine to revisit. Is your SWOLF higher or lower than it was last season? Not sure? Get in the pool and find out. Remember that SportTracks displays your SWOLF scores and many other swimming metrics (Interval, Time, Pace, Stroke, Stroke Rate, Stroke Distance and Efficiency). All of these are explained in our What is SWOLF? post.

SportTracks also enables you to easily filter your workout data over specified lengths of time. You can quickly view your swimming history, and judge your performance from season to season.

Is a 25m pool too short for SWOLF training?

Working on your SWOLF score in a short pool can be beneficial, but, to keep the golf analogy going, it’s like a 9-hole course — not the standard-bearing 18. You can turn at the wall of a 25m pool and swim it again for a 50m effort, but the interference will skew the results, and the information won’t be as accurate.

This doesn’t mean that you shouldn’t bother with SWOLF if you don’t have access to a pool that’s longer than 25m. Working out and performing training exercises is always better than sitting on your butt. That said, if you have the option between a 25 and 50m pool, definitely do your SWOLF training in the longer one.

Can you train without a swim watch?

If you don’t have a swimming watch that can track your SWOLF score (like the Garmin Swim, 920XT, 910XT, or the Suunto Ambit3 or Ambit2), you will need a poolside partner or a coach to keep time and visually count the number of strokes you take. You won’t have all of the advanced swimming metrics to analyze and review in SportTracks, but you can still improve your efficiency.

Swim Golf perhaps isn’t as fun as Marco Polo, cannonballing, or human torpedo dives, but it can help give you a competitive edge and push you toward new PRs.

Training
http://cache.sporttracks.mobi/blog/images/2015/07/swolf-background.jpg

Determine Your Lactate Threshold

$
0
0

I am asked yet again how to find one's lactate threshold heart rate (LTHR) by doing a 30-minute time trial. I really don't understand what seems to be so difficult about this.

—Joe Friel, renowned triathlon coach, 2011

A bit of lactate theory

The benefits of zone-based training are many and varied; but if your zones are inaccurate — the benefits may not be realized.

Heart rate training zones are usually set arbitrarily, based on a supposed “maximum” rate. However, if you go through the trouble of determining your own LTHR, you can construct more accurate zones.

The LTHR is the point, above which, increased blood acidification occurs in your body. Crossing this threshold will make your endurance performance rapidly decrease. In a race, you might maintain that level for up to an hour, but at a certain point you will slow down. When the lactate clears from your system, you can pick up the pace again, but the point is to avoid slowing down altogether.

Blood samples taken during laboratory treadmill tests will determine your LTHR, as shown:

The Lactate Threshold is sometimes referred to as the first turning point (LT on the above graph), however, you need to know when a sustained rise occurs, which is the Lactate Turning Point (LTP on the graph — LTP is the same thing as LTHR). This an important metric for an athlete to be aware of. It gives you a good understanding of what your maximum exertion can be, without going overboard and slowing down. It enables you to put in your best effort on race day.

On the above chart, the LTHR occurred at 14.0km/h and this corresponds to 162bpm. For those of you who are familiar with heart rate training zones, this is approximately the boundary between Zone 4 and Zone 5.

How can I determine my LTHR?

The first problem is that you probably don’t have a fully-equipped scientific sports laboratory in your basement. Then you realize that you probably have a different LTHR for each sport, and the expense of being tested professionally would add up. You might also be concerned that fatigue, caffeine or other supplements will affect your LTHR. And, on top of all of that, you have a different training regime leading up to, and on race day.

Instead of determining your LTHR in a lab, you can estimate it based on a 30 minute test. (30 minutes is widely thought to provide a good estimate.) Keep in mind that a heart rate monitor is required to conduct this test.

Step 1:

Find a flat, uninterrupted course to either run or bike on. A bicycle trainer or a treadmill are acceptable to use as well, as they exclude opportunities to be restricted by traffic, traffic lights, hills, or wind.

Step 2:

Go as fast as you can for 30 minutes, but be sure to press the Lap button on your tracking device at the 10 minute mark, and press Stop at 30 minutes. The average heart rate from the last 20 minutes will be used to estimate your LTHR.

As you can see, the test is straightforward. I wouldn't say it’s simple — because you need to exert maximum effort the entire time. At the end of the test you should be exhausted. If you do it wrong, you will be fatigued and probably not be able to redo the test for a few days, in order to get accurate results.

Performance tips

You can look at the data from previous efforts to help regulate your exertion during the 30 minute test. Look at your last 10k run or your last 10 mile TT (Time Trial), and target the average HR for the last 20 minutes of each. The former race is longer than 30 minutes, the last probably quite a bit shorter. The TT is more likely to give a higher HR than you will be able to sustain in your test, and the 10k run should be close to your LTHR.

Test for each sport

With Garmin's July 2015 announcement of the HRM-SWIM heart rate monitor, all three main sports watch manufacturers (Suunto, Polar, and Garmin) now support the recording of heart rate whilst swimming. This is great, because different sports use different muscle groups. You are likely to have very different levels of conditioning in each sport, and different LTHRs. For example, my LTHR for running is 3bpm higher than it is for cycling, and 7bpm higher than it is for swimming.

Is a 30 minute test really accurate?

Sort of. In my experience, there are many factors that cause errors. Even lab tests have discrepancies, such as: your motivation, fatigue level, caffeine intake, the temperature, etc. My first lab test showed a result that was 5bpm lower than what I found in the 30 minute test. That’s a significant difference.

Is it useful?

Yes. The structure that’s imposed when you train by zones can help you significantly. You can also use “Pace Zones,” “Power Zones,” and zones based on “Perceived Effort.”

Will it remain accurate?

No. As you get more in shape, your LTHR should increase. Re-testing every six weeks or so is a good idea to both determine your improvement and refine your training zones.

Here's a recent 30 minute bike test with the key 20 minute period of heart rate data highlighted. You can see the average HR shown as 175bpm. This is the LTHR. SportTracks makes finding these averages easy.

When you hit the Lap button at 10 minutes and again at 30 minutes, you'll also see the HR displayed in the "Segments" tab in SportTracks. You can then set your HR zones for each sport in your SportTracks profile. Shown below is the 175bpm LTHR transferred to manual HR Zones and the option is given by SportTracks to apply these zones to historical data.

Once you have the same settings on your training watch, you can monitor your training as you exercise. Afterwards, you can review your training in SportTracks to ensure that you are spending the right amount of time in the right zones for your target race, and you can perform many other more complex analyses.

Train with purpose. Train with zones.

Other resources:

This basic spreadsheet calculates your zones and tells you what happens in each zone from a benefits and physiological perspective: http://the5krunner.com/2015/03/02/hr-power-training-zones-running-cycling-swimming-triathlon-spreadsheet/

This fantastic running spreadsheet will keep you LTHR and stat-happy for many, many hours: http://www.electricblues.com/html/runpro.html

This was a guest post by The5kRunner, an avid SportTracks user who regularly writes about all aspects of triathlon, duathlon, 5k running and the gadgets we love.

Training

What is Vertical Oscillation?

$
0
0

Running is primarily a horizontal sport — however much an athlete at the foot of a large hill may tend to disagree. The basic idea is to propel your body forward, not up and down. A conflict exists here, because the physical act of running causes your body to move in more than one direction. As your legs carry you with each step, your torso bounces up and down. This bouncing motion is called Vertical Oscillation (VO), and it’s something you can track and analyze.

Scientifically monitoring the bobble of your body may seem frivolous and unnecessary at first, but VO is closely associated with cadence. Any runner that’s interested in improving their efficiency should be paying attention to their cadence numbers. Being aware of your VO can help you more effectively monitor your progress as you refine your running technique.

VO is measured in centimeters, and most runners oscillate somewhere between 6 to 13cm. It takes energy to move the weight of your body up and down, so the lower your VO, the better. When you consider long distance runs, the misused energy spent on an inefficient bounce can add up. This is why it pays to be aware of your VO, and be willing to experiment with methods to improve it.

How can I track my VO?

Unlike your BO, your VO requires special equipment to detect its presence. The ability to measure and analyze VO debuted with the announcement of Garmin Forerunner 620 in late 2013. It’s part of a suite of metrics Garmin calls Running Dynamics, which also includes Ground Contact Time (GCT) and cadance. SportTracks incorporated these stats into its platform in January 2014.

In order to record VO (in addition to GCT), you need one of the following Garmin GPS watches:

You’re not done yet.

You also need to be wearing either the Garmin HRM-Run heart rate monitor strap, or the recently announced HRM-Tri strap (which can record your heart rate while swimming). Both of these heart rate monitors feature a special accelerometer sensor that enables your watch to record VO and GCT, as well as adding a second means to measure cadence. (All of the compatible watches record your cadence from the wrist as well).

What do the other Running Dynamics tools do?

GCT counts the number of milliseconds that your foot is in contact with on the ground on each stride. Cadence is simply the number of steps you take in a minute. All of the metrics in the Running Dynamics suite are interrelated. As your cadence increases, your GCT and VO should decrease. By working to improve in one of these areas, you are working to improve in all three.

How can I use VO to improve as a runner?   

In the Daniels’ Running Formula book, it’s advised to try to achieve a cadence of 180 steps per minute (SPM). While this number may be better suited for advanced runners and not ideal for everyone, the book makes a valid point of emphasising one of the main advantages gained: When you decrease your VO, you significantly decrease the pounding impact of each foot strike.

Striking the ground heavily creates two negative side effects:

  1. Your feet act as brakes slowing you down
  2. The impact stress increases the likelihood for injuries

The benefits of improving your VO are clear. How you go about training to improve it is up to you. There are many different methods out there worth looking into (ChiRunning and Pose Running are two options).

As you train, you can test out different running methods and see how they influence your cadence, VO, GCT, and speed. The benefit of having the Running Dynamics suite is that you’ll have several sources of data to consider to make more informed decisions — rather than relying only on your SPM number.

Analyzing Vertical Oscillation in SportTracks

If you've got a Garmin 620 and HRM-RUN, you're ready to analyze your vertical oscillation in SportTracks. The three scenarios below will help you understand your running mechanics efficiency as it relates to different conditions.

Is my running form deteriorating as I fatigue?

If you're running a flat course, on even terrain, at a similar pace, you would expect your VO to be similar throughout the run. This isn't always the case if you're running form falls apart from fatigue. To illustrate this, below I'm showing the VO chart overlayed with pace from an 18.5 mile run. I've clicked the Mile 8 marker to lock those stats on the page, and then I've moved my mouse over Mile 18 so I can quickly compare the two miles.

While the pace is nearly the same 10 miles later, my VO has jumped 1.1cm. You can also interpret the data visually and notice VO slopes up the entire workout.

Do my running dynamics change on hills or terrain?

Changes in grade (both uphill and downhill) as well as terrain (pavement, dirt trail, slippery conditions) can have a big effect on your running form, reflected in GCT and/or VO. If you're comparing performance between different events, or looking to a race that will be significantly different than your previous few months of training it can be critical to know these details since ultimately they will affect your performance.

Take a look at the combined view below showing a run along a flat shoreline, followed by a brutal hill climb, along with the associated map view. Notice how the VO varies on hills compared to flat terrain. With the interactive view, you can also look at GCT. (hint: it was all over the place!)

The other thing I like to do when looking at segments of a workout like this is jump to the segment details view by clicking the button in the chart. Here you can find detailed zone breakouts by VO, GCT and cadence that give you a more quantified view.

How does pace change my running form?

Just like grade and terrain, pace can change your running form for better or worse. You can use the same analysis techniques above with multi-chart overlays and segmentation to look at pace. Below is an example showing ground contact time and pace for 1km intervals.

Is tracking your VO a necessity?

Ahh… finally! An easy question! No. Tracking your VO and GTC isn’t a necessity. There have been plenty of runners in the past who got by just fine without it. That said, if you’re interested in fully utilizing sports tracking technology to improve your form and times, using these tools is a welcome advantage. 

Training
http://cache.sporttracks.mobi/blog/images/2015/08/run-dynamics-main.jpg

GPS Elevation Correction

$
0
0

Today we announce a new feature that has been a very popular request from our users:

Elevation Correction!

If your watch or cycling computer gives you unreliable elevation data (either GPS or barometric), now you can fix it with one button click. We've also enabled an option to auto-correct data on new workouts. You can undo elevation correction (to revert to your recorded data), and you can even overlay the original recorded data with the corrected data on a chart to see where differences are. Interested? Read on.

Why is Elevation Correction Important?

As a runner or cyclist your key performance metrics are speed, distance and time. On the other hand your watch will also record changes in your altitude during your workout. You may not know, but these altitude changes are the basis of several calculations related to performance:

  • Your total elevation gain and loss and related personal records.
  • Your equivalent level pace (i.e. Grade Adjusted Pace).
  • Auto-detection of hill climbs, and related metrics (e.g. Vertical Ascent Meters or VAM).
  • Your effort (TRIMP) for speed-based workouts.

However, a problem arises: in some scenarios, elevation recorded from your device can be inaccurate. Inaccurate inputs means inaccurate calculations and inaccurate performance data. This is where elevation correction comes in. If your recorded elevation is bad, you can use our world-wide database of measured ground elevations to "fix" your elevation data and recalculate any related metrics.

Correcting Elevation for a Single Workout

To fix elevation for an existing workout, go to the workout details, click the "Edit" button and select "Correct Elevation"

After some time the page will refresh with your elevation data replaced by data from the ground elevation database. You may notice changes in the elevation gain/loss values, and other fields that have been recalculculated based on the new elevation data.

If you don't like the ground elevation data, you can revert the change by clicking the "Edit" button and selecting "Correct Elevation" to uncheck it.

No need to export your original workout file, or save a copy around like other websites - we do the work for you and make it as easy as a button click.

Viewing Corrected vs Recorded Data

On workouts where elevation has been corrected you can view the original recorded elevation data in the chart. This can be useful to compare the two and see what corrections were made. Select the Elevation (Recorded) option from the chart metric list, either as a single chart or overlay.

Enabling Auto-Correction for New Workouts

If you know your GPS device consistently gives you bad elevation data you can enable an option to turn on auto-correction for every new workout imported into your history. This option applies to workouts added through a sync feature (such as from Garmin Connect or Suunto Movescount), files imported on the website, and data added through our partner API (from services such as tapiriik or apps such as iSmoothRun).

To enable auto-correction for all new workouts go to the My Account > Preferences page:

As with workouts you've manually corrected we'll store your original recorded elevation data. This means you can revert the corrections at a later time with a button click.

How To
http://cache.sporttracks.mobi/blog/images/2015/08/elevation-correction-background.jpg

SportTracks + Moxy Monitor

$
0
0

DURHAM, N.C. — SportTracks, a fitness-tracking software platform that helps athletes and coaches achieve their training goals, today announced a partnership that enables users of the Moxy Monitor to view and analyze their data in SportTracks — creating a robust and complete training solution for this ground-breaking sports technology. 

The Moxy Monitor helps athletes understand how their physiology limits their performance so they can adjust their training to be most effective. Moxy is a small wearable completely non-invasive sensor that uses infrared light to measure oxygen saturation and hemoglobin levels in the muscle.

The information the Moxy gathers can be used to determine which physiological system is limiting an athlete’s performance (cardiac, respiratory, or muscular), and then used to target and train that system for improvement. It’s compatible with mobile apps and sports watches for real-time monitoring, but until now, it has lacked a robust, post-workout analysis application. SportTracks provides in-depth analytics for Moxy data.

“We’re really excited about this new integration partner,” said Aaron Averill, CEO of SportTracks. “The Moxy represents an entirely new class of sport sensor technology that gives new insight into athletic performance; a cutting edge innovation that will impact the next decade of sport tech analytics. Coaches and athletes who use SportTracks can now integrate this data into their existing fitness tracking and analysis practices, right alongside metrics they already understand such as heart rate, power and training load. Getting in at this early stage means we can quickly deliver software solutions as the science of muscle oxygenation analysis evolves and matures.”

SportTracks is focused on providing detailed insights, with a platform that’s fast and easy to use. Above all, this integration is yet another sign of its commitment to provide the greatest possible experience for its users.

About SportTracks

SportTracks is an easy-to-use, yet extremely powerful fitness tracking and planning application for athletes and coaches. It’s compatible with a wide range of devices and mobile apps, and can be accessed from any Internet-connected computer or mobile device. Users love its speed, its simple interface, and the insightful analytics it provides. SportTracks is constantly adding compatibility with new devices and services.

About Moxy

The Moxy Monitor is a disruptive technology that helps athletes understand how their physiology limits their performance so they can adjust their training to be most effective. Measuring oxygen saturation and hemoglobin levels in the muscle through the application of near-infrared spectroscopy (NIRS), the Moxy is guiding the training of thousands of athletes in 22 countries including Olympic Gold medal skiers, professional hockey players, age-group triathletes, college athletes and health focused older adults.

News

SportTracks + Epson Partnership

$
0
0

DURHAM, N.C. — SportTracks, a fitness-tracking software platform that helps athletes and coaches achieve their training goals, today announced a partnership that will allow users of Epson Runsense wearable sports-tech devices to seamlessly view their data in SportTracks.

Owners of Epson Runsense GPS watches will now be able to activate a free auto-sync functionality in SportTracks. When a workout is completed with a Runsense watch, the data from the activity will automatically be uploaded to SportTracks where athletes can perform further analysis. SportTracks enables you to analyze your training progress, set and track goals, communicate with coaches, and share activities with other users and social media.

“We are thrilled with this partnership,” said Aaron Averill, CEO of SportTracks. “Now athletes can spend less time transferring data and more time incorporating immediate, actionable insights into their training plan. You can walk in from your run, hit the stop button on your Runsense, open SportTracks on your smartphone, and have the most robust analysis available, right at your fingertips.“

“Performance athletes have busy lives and need a seamless training experience,” said Averill. “Data from all their devices should be available wherever they are. They want to go from recording data, to analyzing performance, to planning their next workout, and they want that experience to be as easy as possible.”

SportTracks is focused on providing detailed insights, with a platform that’s fast and easy to use. The integration with Epson Runsense is yet another sign of its commitment to provide the greatest possible experience for its users.

About SportTracks

SportTracks is an easy-to-use, yet extremely powerful fitness tracking and planning application for athletes and coaches. It’s compatible with a wide range of devices and mobile apps, and can be accessed from any Internet-connected computer or mobile device. Users love its speed, its simple interface, and the insightful analytics it provides. SportTracks is constantly adding compatibility with new devices and services.

About Epson

Epson is a global technology leader dedicated to driving innovations and exceeding customer expectations in printing, visual communications, quality of life and manufacturing. Epson's lineup ranges from inkjet printers, printing systems and 3LCD projectors to industrial robots, smart glasses and sensing systems and is based on original compact, energy-saving, and high-precision technologies.

Led by the Japan-based Seiko Epson Corporation, the Epson Group comprises nearly 70,000 employees in 94 companies around the world, and is proud of its contributions to the communities in which it operates and its ongoing efforts to reduce environmental burdens. Epson America, Inc. based in Long Beach, Calif. is Epson’s regional headquarters for the U.S., Canada, and Latin America.

News

Connecting with Epson

$
0
0

Today we announce another sync integration partner: Epson Runsense

Epson is one of a few brands that now support optical heart rate - your heart rate is measured right from your wrist. This means no more heart rate strap, no batteries to change, no uncomfortable chafing and no forgetting to put it on!

While other brands such as the Forerunner 225 now also offer optical heart rate, we like the Epson for a few reasons:

  • 20 hours of battery life - nearly double the FR225
  • Barometric elevation sensor
  • "Hands off" sync with SportTracks

And now... a quote from DC Rainmaker - tech gadget enthusiast...

When I first met with Epson last summer, they were rather proud of their GPS accuracy – almost taunting me to find issues with it... But they have reason to be proud, they’ve done fantastically well there. It is as good or better than any unit I’ve seen in the various conditions I’ve run in (cities, forests, deserts)... Over and over again it proves itself. Even when other watches were ‘good’, the SF-810 tended to be just a little bit better.

Great GPS, an optical HRM, and a reasonable price. What's not to like?


Configuration

1. Click the My Account link in the upper right corner of the app and navigate to the Sharing page.

2. Click the Connect button.

3. Select the Epson Runsense option.

4. Log into the Runsense website and authorize SportTracks to talk to your data.

5. Click Finish.

Once authorized, all you need to do is plug your watch in as you would normally do to import to Runsense through the Run Connect agent. SportTracks will check Runsense every 10 minutes for new workouts that you've uploaded from your watch and integrate them into your history.

You can check the status of the sync connection by going to the Sharing page under My Account:

Using Epson with SportTracks gives you the best of both words - a watch with convenient strapless heart rate monitoring, and the advanced tracking, analysis and planning features you demand.

~Enjoy

Shop for a Runsense Watch on Amazon

How To
http://cache.sporttracks.mobi/blog/images/2015/08/epson-runsense-background.jpg

Integrating with Moxy Monitor

$
0
0

SportTracks recently announced an integration with the innovative Moxy Monitor wearable device, which enables you to track muscle oxygenation data. This integration is big news, because it creates an entirely new way to track, analyze, and improve your fitness. In this post, we’ll explain how muscle oxygenation data can help you as an athlete, and how you can load data from the Moxy Monitor into SportTracks.

For existing Moxy users, the SportTracks integration is a breakthrough, because while this device has had ample support for real-time monitoring via specific sports watches and mobile apps, it lacked a tool for post-workout analysis. For the first time, SportTracks enables you to view muscle oxygenation data on a graph, and analyze how it interacts with other elements of a workout, such as pace, heart rate, and more.

What can muscle oxygenation data tell me?

Understanding blood oxygenation levels can benefit athletes and coaches in several ways. It enables you to determine which of your physiological systems is limiting your athletic performance (cardiac, respiratory, or muscular). Once you determine what’s impeding your performance, you can then use the Moxy to target, train, and improve that system.

The device itself isn't much larger than a typical heart rate monitor module. You attach it to your body before a workout, preferably adhering it with tape in order to avoid exposing its sensor to light (to get the most accurate readings). The Moxy is waterproof, so it can be worn by competitive swimmers — a perfect match for the advanced swimming analytics provided by SportTracks.

How does the Moxy Monitor work?

Have you ever held the flashlight up to your hand and marveled at the sight of the light shining through in a somewhat eerie, blood-red hue? Of course you have! In a way, this is how the Moxy Monitor works. It uses infrared light diodes to detect changes in the color of your blood, which is indicative of its oxygen content.

How to use the Moxy Monitor with SportTracks

The following instructions require a Moxy Monitor, a PC (or a Mac running PC emulator software), and SportTracks Pro. When you track a workout with a Moxy Monitor, it's advisable to also track with a GPS device or a mobile sports app (so you will have more than just blood oxygenation data).

  1. Plug the Moxy Monitor into a USB port on your computer.
  2. Open the Moxy PC application on your computer, and download the data from the connected Moxy Monitor to the destination of your choice (a specific folder on your hard drive, for example).
  3. You now need to import the data you just downloaded from the Moxy Monitor, and import it into the desktop version of SportTracks. Click the "Import" button and navigate to the location where you saved the Moxy Monitor .FIT file, and click "Next".
  4. In the dialog box that opens, select the “Update existing activity” button, then in the “Activity to update” menu, select the specific activity that you want to import the Moxy Monitor data into. Also be sure to select “No” from the “Adjust data start times” options.
  5. Click “Finish.”

Now you will be able to see the Moxy Monitor data alongside your other workout metrics when you click the “Select more charts” icon in the Pace/Time screen, and select SmO2 and Thb charts.

Once your Moxy data is loaded into your logbook, save your logbook and let it sync to your web-based account at SportTracks.mobi. Now you can share your workouts with your coach or athletes. The SmO2 and Thb charts can be selected from the chart metric option to overlay with heart rate, pace, etc.

Instructions for performing this task with Garmin watch be found in this video.

More recent Garmin watches like the Fenix 3, Vivoactive, Forerunner 920XT, and Epix feature the ability to display Moxy data in real time as you're working out (using separately available Garmin Connect IQ apps). However, these watches are not required to record your blood oxygenation data with a Moxy Monitor and then upload into SportTracks for analysis.

Sounds good. How do I get one?

If you're interested in integrating this new device into your fitness routine, check out the Moxy Sensor Store. Happy hemoglobin tracking!

How To
http://cache.sporttracks.mobi/blog/images/2015/09/moxy_monitor_exploded_800_600.png

Aerobic Efficiency Explained

$
0
0

Top performing endurance athletes are very efficient. They produce a large amount of output (in the form of forward speed or power) at a minimal aerobic cost. One important part of fitness performance training is to improve your efficiency. The more efficient you are, the better you're going to perform in races. Knowing how your aerobic efficiency is improving (or not...) is a key factor in planning your training and setting performance expectations for competition.

How can we measure improvement in aerobic efficiency?

Pros have access to performance assessment labs, and a team of professionals that can run the tests. Most of us aren't so fortunate. Luckily, with SportTracks all you need is a GPS or bike power meter and a heart rate monitor. With these two sensors we can calculate your aerobic efficiency (AE), allowing you to track and monitor improvement.

Aerobic efficiency is a new metric we display in two places:

1. On the workout detail page in the top "total blocks" you'll find aerobic efficiency located in the heart rate block. Click or tap the block to cycle to the aerobic efficiency metric.

2. On the workouts list page you can add the new aerobic efficiency column to monitor changes across a season (or years) for a particular sport and type of workout.

Aerobic efficiency theory and practice

The theory behind aerobic efficiency is simple: it measures the ratio of intensity to effort. For running, intensity is indicated by your pace: higher pace = higher intensity. For cycling intensity comes from your watts: higher watts = higher intensity.

In all sports the effort in this calculation is measured by your average heart rate. We know from basic physiology that as your intensity increases your heart rate must also increase - muscles require more oxygen supplied by your heart. On the other hand, a more efficient athlete will be able to maintain a higher intensity with lower effort, resulting in a higher AE ratio.

Effective training will show a visible improvement in aerobic efficiency. Conversely, if over a season you see that your workouts with consistent intensity are requiring more effort (decreasing AE), it may indicate problems in aerobic endurance.

A few important notes when you're looking at trends in aerobic efficiency:

  • Aerobic efficiency is best measured on longer, steady aerobic workouts (sub lactate/anaerobic threshold). AE numbers for interval workouts may not be relevant.
  • Because intensity is measured by speed or power, different sports will have different AE numbers. Be sure to filter your workout list by sport and workout type (using the text filter).
  • As much as possible you should compare AE numbers on similar courses (terrain, road surface) in similar conditions (weather, nutrition, sleep/fatigue) since these things will effect both the intensity and effort.
  • There is no absolute AE number you can use to compare performance across athletes. Each athlete will have different numbers, and improvements should be recognized as relative changes in the number for an individual athlete.

Training tips

Endurance training guru Joe Friel recommends doing regular aerobic threshold workouts as a way to assess efficiency changes. Basically this is a standard duration run/ride (say, 30 minutes) at 28-32 BPM below LT HR.

Once you've completed your workout, add a tag to the notes such as "#AETest". You can now use the text filter on the workouts page to list only those workouts with "#AETest" for a particular sport. Make sure you've added the aerobic efficiency column and sort the list by date. If fitness is improving, you should see your AE number go up over weeks or a season.

Doing these tests periodically and using the aerobic efficiency metric in SportTracks can be helpful if you're not able to find the time (or money) to go to a proper performance assessment lab.

Training
http://cache.sporttracks.mobi/blog/images/2015/10/aerobic-efficiency-background.jpg

Critical Power Training

$
0
0

If you only have a passing interest in endurance cycling, you probably have heard of power-based training. It’s an innovation that has revolutionized the cycling world. In this article, we cover the fundamentals, and show you how to leverage the tools in SportTracks to fully optimize your efforts.

What is power-based training?

Power-based training is a type of cycling training that is reliant on a piece of equipment called a “power meter,” which must be installed on the bicycle. A power meter is exactly what it sounds like: It’s a device (or a system of sensors) that accurately measure how much power you generate as you push the pedals. This measurement isn’t impacted by high or low gears. A properly-calibrated power meter gives you accurate, actionable information whether you’re spinning or mashing up a hill.

Your effort is measured in “watts.” What makes power meters so appealing is how your wattage numbers can be used to accurately train and improve your fitness as a cyclist. Power meters can help you strategically compete in races, too. In short, when you dedicate yourself to power-based training, you will see results. That's why it’s so popular, and genuinely revolutionary to the sport.

Many athletes and coaches are so enthusiastic about power-based training that they strongly recommend prioritizing the purchase of a power meter when budgeting for a bike. The general idea is that you’re much better off using a decent bike with a power meter, as opposed to using an amazing bike without one. Don’t sacrifice your power meter in favor of other high-quality components. If you understand how much technology can help you improve as an athlete, a power meter is a must.

What is Critical Power?

Similar to an athlete’s Lactate Threshold Heart Rate, Critical Power enables you to determine the highest average effort you can maintain for a specific period of time. It empowers you to accurately understand the average wattage you are capable of sustaining, without blowing up and burning out.

A runner who utilizes zone training knows if they exceed their LTHR, they are going to over exert themselves and slow down — finishing with a worse overall time. Critical Power works the same way for cyclists, with the additional benefit of having data that's far more accurate.

One downside to heart rate zone training is its accuracy. Outside factors can influence and skew heart rate data. For example, caffeine intake can impact heart rate data. A power meter isn’t swayed by outside forces. You can look at your wattage immediately when you start riding and pace yourself accurately all the way to the finish — and trust that the data is accurate, regardless of the amount of espresso you slurped down.

What's the diffrence between Critical Power and FTP?

Functional Threshold Power (FTP), a measurement popularized by Dr. Andrew Coggan, is the maximum sustainable power output you can hold for one hour. Critical Power (which is often abreviated to CP) is used to measure various intervals of time. CP60 is the Critical Power average for 60 minutes. CP60 is essentially the same thing as FTP.

Determining the maximum effort you can sustain for one hour on a bike is a demanding task. Shorter tests are often used to determine Critical Power, to avoid completely exhausting a cyclist in the middle of training. You can discern the same information that you would get from a one-hour FTP or CP60 test with shorter CP30 or CP20 tests, and a little math. More on this later in the article... 

How to determine Critical Power

A bike outfitted with a power meter is required for Critical Power tests. It may be more practical to use a bike on an indoor trainer, as the test requires you to ride for a long period of time without stopping.

You should also have a device to record your workout. Bike computers are often used in conjunction with power meters. They’re usually mounted to the stem, and feature a top-facing screen that displays wattage and other information.

Some GPS watches can be used to monitor and record data from a power meter (such as the Garmin 920XT). You can even use a smartphone as a bike computer, as long as it has the required sensors to receive ANT+ and/or Bluetooth data (depending on what kind of power meter you’re using). It’s also useful to record your heart rate data during this test, so wear a HRM if you have one.

The test

Make sure you have fresh legs and are properly hydrated before, during, and after the test (consider having some cool chocolate milk to chug down when you're finished). If you’re conducting the test indoors on a trainer, make sure you have towels and a sufficiently powerful fan to avoid overheating.

There are several ways to conduct these tests. For a CP20 test, a 15-minute easy warmup ride is usually recommended to get started. From there, you begin a series of four or five high-intensity one-minute interval drills, followed by three minutes of easy riding. Next, build up to a strong pace and go as hard as you can for twenty minutes, non-stop. The average wattage from the 20 minute stretch multiplied by .95 is your FTP, or, CP60 score. Why do you multiply at the end? To compensate for the amount of effort you would expend in a 60-minute test. You have a lot more energy to burn in a 20 minute test as opposed to a 60-minute test, so the math compensates for this.

As you train and improve your fitness, your numbers should improve as well. Even though the tests are exhausting, you should execute them every six weeks or so, to be certain your numbers are consistent with your current fitness level.

When you execute Critical Power tests, you can then calculate your “body weight to power ratio.” This ratio enables you to accurately compare how your performance stacks up against other cyclists. It's a vital tool for cycling teams and coaches. There are several free tools available online that can help you calculate your body weight ratio. If you enter your current weight into SportTracks (or if you do this automatically with a synced smart scale), SportTracks will calculate this for you.

Using SportTracks for performance analysis

SportTracks enables you to view power zone data on a graph, and to overlay other metrics from the workout for a deeper, more actionable understanding of your fitness. Most power meters also measure cycling cadence. In SportTracks, you can easily overlay your cadence chart over your power plots, to see how they interrelate. It's also helpful to overlay your power with pace, heart rate, and the grade charts from your workouts.

SportTracks also features extensive segment analysis, which utilizes automatic hill climb detection. You can view each hill segment individually, which features a section that displays your critical power for the segment and the overall ride.

The Personal Records section of SportTracks enables you to filter the view by a date range. You can include the "best efforts all rides" critical power chart, and then filter by date range. This will give you an accurate picture of your power performance history.

The entry-level price for power meters has dropped significantly in the past few years. They are still expensive, but, if you're serious about cycling, this could potentially be one of the most important parts of your bike. With the barrier of entry dropping, it's a great time to start training with power, and take your performance to new heights.

Training
http://cache.sporttracks.mobi/blog/images/2015/09/tri-bike-race-critical-power.jpg

Using SportTracks with RunGap

$
0
0

Today RunGap - a workout data manager for iOS - has announced sync integration with SportTracks.

If you're a Polar user this is particularly exiting as RunGap syncs with the Polar Flow website. Using RunGap Polar users can now get their data into SportTracks for advanced analysis. RunGap also supports many other popular platforms such as Nike+, Adidas, and Magellan.

Connecting from RunGap to SportTracks

To connect RunGap to your SportTracks account:

  1. Select "Accounts & Settings" from the upper left menu in RunGap.
  2. Select "SportTracks."
  3. Tap "Connect".
  4. Enter your username and password and authorize RunGap to access your SportTracks account.

RunGap will now connect securely to your SportTracks account.

Sharing your activities on SportTracks

You can upload a single activity directly to SportTracks by opening it from the "Activities" list, tapping the "..." button in the upper right corner and choosing "Share." This will bring up a page where you can choose to share the activity to on or more of the most popular services including SportTracks along with an optional message. The activity will then be uploaded to SportTracks and you will hear a "swoosh" sound when the upload is complete. If the activity already exists on SportTracks, only the title and activity type is updated.

Similarly, you can upload all your activities directly to SportTracks by choosing "Share & Export" from the upper left menu and then "SportTracks." RunGap will then upload all activities missing on SportTracks and update the titles and activity types for the rest. This may take a while the very first time, but RunGap will automatically skip previously uploaded activities which have not been modified and therefore subsequent exports will complete much faster.

Please note that the in-app "Swag Bag" update is required in order to share activities directly to SportTracks.

The SportTracks partner list keeps growing...

RunGap joins a large and growing list of partner devices, smartphone apps, websites and trainer software that integrate and sync directly with SportTracks. We know your time is important and we aim to make data tracking as convenient as possible, so you can focus on your fitness.

For a complete list of compatible solutions visit our Partners page.

How To
http://cache.sporttracks.mobi/blog/images/2015/10/rungap-sync.png
Viewing all 221 articles
Browse latest View live