Many ingredients are required to train for a marathon, and two of the bigger ones are willpower and ambition. While you can never have too much willpower, it is possible to overdo it with excess ambition. How can it get the best of you? When training for a 26.2 mile effort, you need to have a good idea of what your pace should be for the majority of the course. If you take off like a bolt of lightning and leave your normal pace behind in the dust, you can run out of gas long before you get anywhere near the finish line.
Without a doubt, pacing plays a major role in both marathon training and in the race itself. In this article, we go over the nuts and bolts of pace, and offer advice for finding the ideal marathon goal pace to suit your personal level of fitness.
![]()
Step 1: Nail the basics
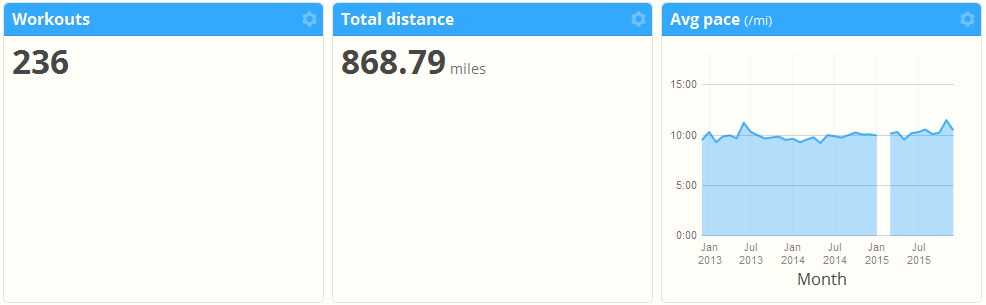
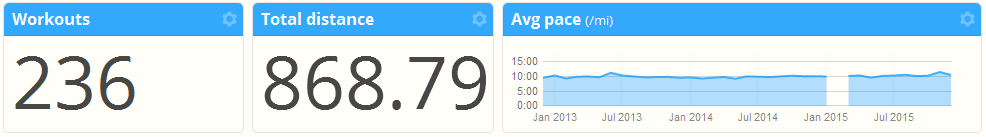
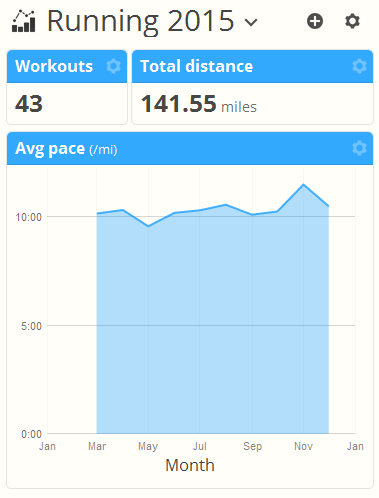
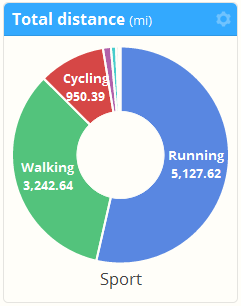
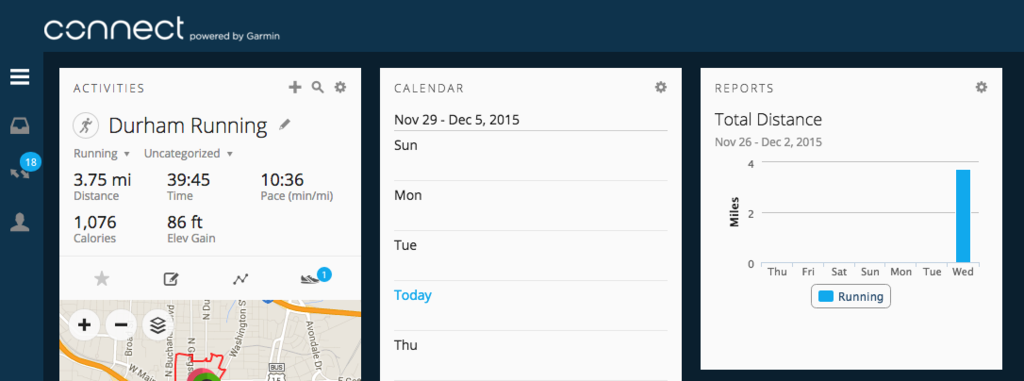
Let’s review the basics of pace, so beginners get all of the information they need, and so experienced runners can confirm what they may already know. Pace is the amount of time it takes you to complete a mile or a kilometer. In SportTracks, pace is split up into three separate stats to give you a broader understanding of your fitness:
The first one, Pace, is your average pace from the entire workout. Speeding up, slowing down, and taking breaks all impact this number. The second, Max Pace, is the fastest pace you recorded during your run. The last one, Level Pace, is a little more involved. This number gives you a theoretical idea of how fast you would have run if there had been no hills in the course. In fitness training, Level Pace is also often referred to as Grade Adjusted Pace (GAP).
Step 2: Track and monitor
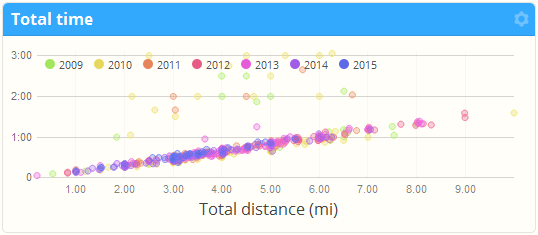
When you begin training, it’s important to keep track of your pace as you’re running. To do so, using a GPS sports watch or a fitness tracking app is strongly recommended. It won’t take you long to find a comfortable pace for longer runs. As your training intensifies and the distances increase, knowing how fast of a pace you can sustain for long periods of time becomes crucially important.
Running a sub two-hour marathon is the ultimate goal of every endurance runner, but for most of us, it’s just good fodder for daydreaming.
Step 3: Set a time goal, and use pace to train for it
Running a sub two-hour marathon is the ultimate goal of every endurance runner, but for most of us, it’s just good fodder for daydreaming. Therefore, it’s advisable to set a realistic marathon time goal for yourself based on your current fitness. A free online running pace calculator can help you determine a good marathon time for yourself. The RunnerSpace calculator is one we recommend for it's simplicity.
In order to properly use a running pace calculator, you need to determine the appropriate Distance and Time to enter into it. You need stats from a recent race (or a race-like training run), or a recent PR. The idea is to enter your strongest recent effort near the target distance (for example: one that isn't over two years old), so the calculator can estimate your best possible marathon time based on your ability.
Here's how to determine the Distance and Time to enter into a running calculator:
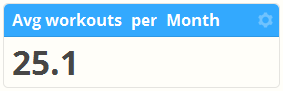
1) Go to the Personal Records section of SportTracks
2) In the right corner, filter the sports type to display "Running"
![]()
3) Check out your records. If you have a recent PR, use it for the calculator. If not...
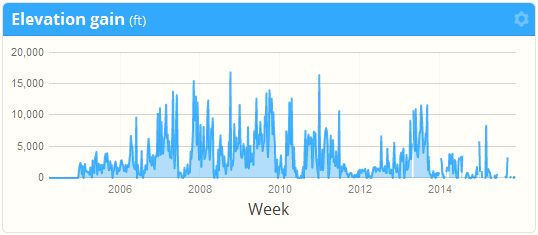
4) Click on "All dates" in the upper right corner, and filter by the current year
![]()
5) If you still can't find an applicable workout, filter the dates again by the previous year
![]()
6) In the example above, the athlete ran a 24:03 5K as a part of an 8K race. This is the most applicable data we've found yet, but let's look a little more, just to be thorough.
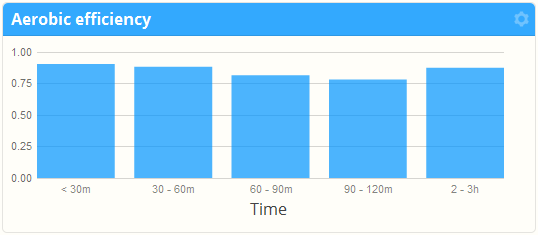
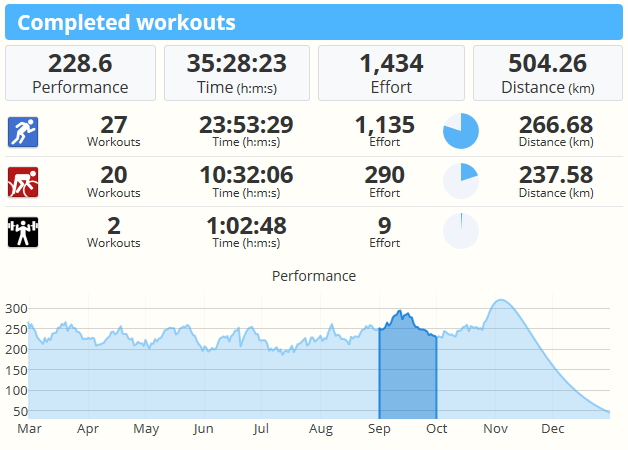
7) Go to the Workouts page in SportTracks
8) Click the "Search By" box, select "Sport" from the menu, and click "Running"
9) Click the "Search By" box again, select "Text" from the menu, type "Race" and hit Enter
10) Sort the Distances by clicking on that column
![]()
11) Looking at the workout history, we confirm that the 24:03 5K is the most recent data
12) For this athlete, we enter a Distance of 5K and a Time of 24:03 into the RunnerSpace calculator
13) In the results, we scroll to the second to last row. The suggested average marathon time for this athlete is 3:54
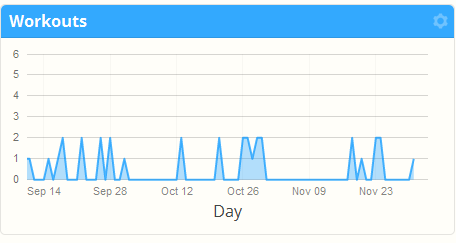
Once you determine your time goal, you can establish a focused training plan leading all the way to race day. As you work to get there, understanding your pace is key. How fast you are as a long-distance runner should become more and more obvious as you train. Similar to your Lactate Threshold Heart Rate, you will begin to understand the thresholds of your pacing.
![]()
Step 4: Listen to your body and live in the moment
We all want to run the fastest race possible, but when we’re talking about a full marathon, what gets you to the finish line the fastest is how smartly you train, how carefully you pace yourself, and how strategic you are with your available energy.
If you check your pace early in the race and it’s much faster than normal, you need to be careful. Runners often pick up extra energy from being in an actual competition — and it can work to your advantage to go with it and use this energy for a faster run. But, if you still have a great distance to cover and you’re pushing too hard, you’re in danger of overdoing it, slowing down, walking or even dropping out.
The most common advice is to aim for a negative split in a race, meaning that you run more conservatively for the first half and faster for the second. This can make for a more enjoyable racing experience, because by strategically leveraging your energy reserves, you get to eventually pass many of the lightning bolts who darted off at the start and tuckered out sometime later.
But, who knows? Maybe the most common advice isn’t what suits you best. Either way, the key here is to use pacing and tracking to your advantage. Have a plan for race day, and strike a balance between how you’re feeling in the moment, and what you know you’re capable of from training.
Step 5: Get to work
The fresher your data is, the more accurate your pace and time goals can be. Hop into your Calendar in SportTracks and start planning some training runs that will give you clear idea of what you’re capable of. Hurry up, your next PR is waiting for you at the finish line with a free banana and a couple pints of beer.


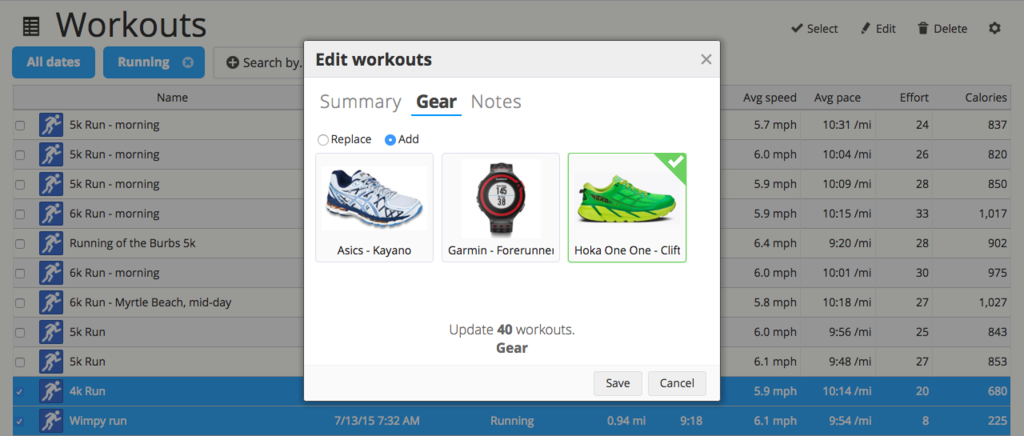 Boom! The gear will be added to every past workout you checked off. You will now be able to see its usage stats in your Gear page!